Oil, fundamental analysis
The prices for crude futures are just that...future prices based upon the perceptions of market participants. Thus, the perception of Russian exports being cut by sanctions led to last week’s rally. This week, the perception of the impact of Trump’s tariff threats and, his call for OPEC to make crude less expensive led to lower prices after last week’s announced Israel/Hamas ceasefire. However, no actual supply/demand dynamics have changed significantly to-date.
Geopolitical tensions have abated for the time being and another crude inventory draw was pitted against further gains in gasoline stocks. The US light-sweet grade cascaded lower in the holiday-shortened trade week as WTI’s High for the week was $77.50/bbl. on Monday while the Low was Friday’s $74.00. Brent crude, in similar fashion, fell throughout the week as its Hi/Lo was $81.20 on Monday and $77.60 Friday. Both grades were lower on the week. The WTI/Brent spread has widened to -$3.75/bbl.
During his virtual speech to the World Economic Forum, the new US President called for Saudi Arabia and OPEC to increase output to lower global oil prices. Trump believes that move will hurt Russian revenue and, in turn bring an immediate end to the Russia/Ukraine war. The responses from both Russia and OPEC have been muted but oil prices reacted by falling, nonetheless.
Additionally, traders are eyeing Trump’s pledge to implement wide-ranging import tariffs Feb. 1, which are seen as hurting crude-importing countries and thus, lowering demand. And, despite several Executive Orders issued that will open federal lands and lessen red tape, US exploration and produciton companies are expected to “stay the course” and continue to focus on free cash flow, resulting in dividend payouts and share buybacks for shareholders.
The new administration is also considering re-sanctioning Venezuela which would impact about 200k b/d of oil production from US company Chevron Corp.
Bloomberg is reporting lower exports of Russian Urals from a key port on the Baltic Sea although it’s not known if there is a direct correlation tied to the recent increase in US sanctions. Meanwhile, in a research report, JP Morgan is forecasting growth in global oil demand in the coming weeks to be at the 101.4 million b/d level, a +1.4 million b/d increase over last year at this time.
The Energy Information Administration’s Weekly Petroleum Status Report indicated that commercial crude oil and distillate inventories for last week decreased while gasoline stocks increased.
Inventory at the key Cushing, Okla., hub changed -150k bbl to 20.7 million bbl, or 28% of capacity. The Strategic Petroleum Reserve (SPR) gained 0.25 million bbl to 395 million bbl. Total US oil production dipped 4,000 b/d to 13.48 million b/d vs. 12.3 million b/d last year at this time. LyondellBasell has started the permanent closure process at its 263,000 b/d refinery in Houston (OGJ Online, May 31, 2023). This comes after the recent announcement by Phillips66 to retire its Los Angeles complex (OGJ Online, Oct. 17, 2024).
Last week’s unemployment figures increased by a modest 6,000 to 223,000 vs. forecasts of 220,000. And, while slightly off Friday, all three major US stock indexes posted their 2nd-weekly gain after trading in record territory. The USD is lower but is not providing support for crude.
Oil, technical analysis
March 2025 NYMEX WTI Futures are now front-and-center as prices have dipped below the 200-, 13- and 8-day Moving Averages but above the 100-day and around the 8-day MA. Volume is about average at 220,000. The Relative Strength Indicator (RSI), a momentum indicator, is “neutral” at the “51” mark as this week’s selling has offset last week’s buying rally. Resistance is now pegged at $75.05 (200-day MA) with near-term Support at $74.00.
Looking ahead
Canada’s Trans Mountain pipeline is considering a further expansion as the threats of US tariffs have Alberta producers looking for additional capacity to their West Coast. Meanwhile, among the executive orders signed on Monday was a recission of the revocation of the international border crossing permit for the proposed Keystone XL pipeline which had been denied by President Obama, approved by President Trump, and then denied by President Biden. However, the current owners of the project, TC Energy subsidiary South Bow Corp., has said, "we’ve moved on from Keystone XL.”
The US oil and gas rig count continues to decline but production remains above 13.0 million b/d due to operational efficiencies. With falling prices currently, an increase in drilling activity is not likely in the near term despite the new executive orders.
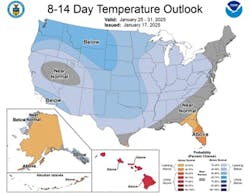
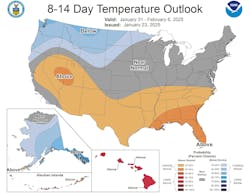
Heating oil demand has been strong for the past 2 weeks and should remain robust until the first week in February where more mild temperatures are expected.
Natural gas, fundamental analysis
Despite another huge storage withdrawal reported for last week, February natural gas futures are lower this week in part, because the withdrawal was less than forecasted. Additionally, early forecasts for February are calling for milder weather.
The Henry Hub High was $4.05/MMBtu on Thursday with a Low of $3.71 on Wednesday. February 2025 NYMEX futures will expire next Wednesday, Jan. 29. Meanwhile, European natural gas storage levels have fallen to about 58% as Winter Storm Eowyn pummels the UK. Buyers in the EU & UK are lining-up summer LNG deals to replenish the stocks as more withdrawals are anticipated in the coming weeks.
Spot prices at the Dutch TTF import facility were recently at $14.40/MMbtu equivalent while TTF futures were $12.45. Back in the US, supply last week was -0.3 bcfd to 110.2 bcfd vs. 110.5 the prior week. Demand was +8.7 bcfd to 157.1 bcfd vs. 148.4 bcfd the week prior, with the biggest increase in residential and power consumption.
Exports to Mexico were 6.7 bcfd vs. 6.8 the prior week. LNG exports were 14.7 bcfd vs. 15.4 bcfd the prior week as Freeport LNG experienced a storm-related power outage. The EIA’s Weekly Natural Gas Storage Report indicated a withdrawal of 223 bcf vs. a forecast of -251 bcf and vs. the 5-year average of -167 bcf. Total gas in storage is now 2.892 tcf, dropping 1.9% below last year and just 0.7% over the 5-year average.
Natural gas, technical analysis
February 2025 NYMEX Henry Hub Natural Gas futures are trading around the 8-day Moving Average but just above the 13- and 21-day MAs. Volume below-average at 60,000 as February expires next week and traders turn their attention to March. The RSI is “neutral” at “55”. Support is pegged at $3.80 (21-day MA) with Resistance at $3.98 (8-day MA).
Looking ahead
As with heating oil, the next 7 days look favorable for natural gas demand but early February looks bearish. The Freeport LNG plant is back up and running at capacity. Oil majors are anticipating a drop in revenues associated with LNG sales as prices have become more stabilized amid new supply sources.
About the Author

Tom Seng
Dr. Tom Seng is an Assistant Professor of Professional Practice in Energy at the Ralph Lowe Energy Institute, Neeley School of Business, Texas Christian University, in Fort Worth, Tex.


