Oil, fundamental analysis
New week, same market volatility.
Last week’s precipitous fall in oil prices, tied to the US tariff announcements, carried over into this week only to slightly rebound at week’s end. A lower global demand forecast, a build in crude stocks and OPEC+ plans to increase output May 1st all amounted to “piling-on” to an already bearish marketplace. The only bullish turns occurred mid-week on the tariff delay as well as reported draws in refined product inventories. WTI’s High for the week was Monday’s $63.90/bbl with the Low of $55.12 printing early Wednesday. It was the lowest price since September 2021 and a level that a recent Dallas Fed survey indicated was not profitable for the industry.
In an almost identical pattern, Brent crude saw its weekly High of $67.75/bbl occur on Monday while the Low was Wednesday’s $58.40, which was the first time in 4 years that Brent traded below $62. The Brent/WTI spread now stands at ($3.25). Both grades settled slightly lower week-on-week.
Plummeting prices got a brief reprieve late Wednesday as President Trump announced a 90-day delay on the new tariff implementations for countries other than China. That exclusion has led to a game of tariff “tit-for-tat” between the two superpowers. Even though the delay sparked a rally in equity and commodity prices, traders focused on the temporary nature of the reprieve which only delays the uncertainty surrounding the impact of the tariffs. As a result, the net effect on prices this week was minimal.
The EIA has reduced its global crude demand forecast for this year to 103.6 million b/d from 104.5 million b/d. The agency cited slowing economic growth due to tariff implementation as well as the rolling-out of OPEC+ output increases. Meanwhile, the OPEC+ group is going head with its planned production increase of 411,000 b/d May 1 despite the considerably lower prices. Analysts believe the coalition wishes to regain lost market share and, with falling prices, they need to improve their position now.
The Iraqi Oil Ministry has reiterated its goal to achieve a production target of 7.0 million b/d within the next 5 years while Chinese exploration and production firms dominate the oil and gas industry there. Meanwhile in Oman, direct US/Iran talks will take place Saturday. Prior announcements of “progress” in these negotiations have had a bearish impact on global crude prices.
The Energy Information Administration’s (EIA) Weekly Petroleum Status Report indicated that both commercial crude oil inventories and the Strategic Petroleum Reserve increased while crude production was 13.5 million b/d, down slightly from the prior week’s 13.6.
There was some positive economic news this week as the CPI and PPI both came in lower-than-expected. Inflation unexpectedly dipped by 0.1% last month, which was the first such decline in 5 years and was largely the result of lower energy prices. The 2.4% annualized increase compares with February’s +2.8%. However, food prices continued to rise. The Producer Price Index fell last month by the most since 2023, dropping 0.4% from February compared with forecasts of +0.2% with lower energy prices seen as the main reason. The PPI is actually the Federal Reserve’s preferred indicator of inflation. On the flip side, consumer sentiment fell to 50.8% from 57% the prior month and is nearing a 3-year low as inflations worries are at their highest level measured since 1981. Claims for unemployment benefits rose only slightly on the week. All 3 major US stock indexes rose late week to post small gains but are far from where they were pre-tariff implementation. The USD ended lower week-on-week which is providing some support for oil prices.
Oil, technical analysis
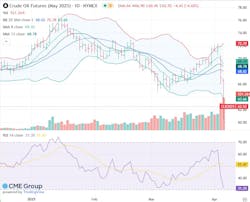
NYMEX WTI Futures remain well-below the 8-, 13- and 20-day Moving Averages, having breached the Lower-Bollinger Band limit at one point. Volume is 270,000, down from the record 600,000 Tuesday and Thursday. The Relative Strength Indicator (RSI), a momentum indicator, is “oversold” at the “38” mark after dipping below “30”. Resistance is now pegged at $63.10, the 8-day MA with near-term Support at $58.75 (Lower-Bollinger Band). The current forward market pattern is “backwardated”, a condition where near-term prices are higher than longer-term. It represents more trader confidence in demand in the short-term and uncertainty further out. A “normal” growth-centered outlook would be “contango” where each successive month’s price is higher than the prior month, indicating constant demand growth.
Looking ahead
Airlines, refiners and shippers are said to be taking advantage of the lower price environment by entering into energy financial derivatives such as buying futures, forwards, swaps and options. “Bargain” buying is always symptomatic with a price crash. US refiners are expressing a reluctance to make infrastructure investments given the very “light” composition of domestic shale oil which comprises almost 70% of US production. The shale oil is normally blended with heavier grades such as those coming from Canada, Mexico and Venezuela. 70% of US refineries are configured to handle heavier crudes and where new or retro-fitted refineries can take the shale oil, that has been a costly and time-consuming undertaking. Given some of the historic dips in both financial and commodity markets, we should expect some more upside but just how many buyers are out there has yet to be seen.
Natural gas, fundamental analysis
US natural gas futures also had another down week as the tariff-induced volatility was coupled with “shoulder” month demand and the 4th-consecutive storage injection. The week’s High of $3.95/MMbtu occurred Monday with the week’s Low of $3.35 set early Wednesday
Supply last week was +2.3 bcfd to 112.4 bcfd vs. 110.1 the prior week. Demand was +7.1 bcfd to 108.8 bcf vs. 101.7 bcfd the week prior, with the biggest increases coming in Residential & Power consumption.
Exports to Mexico were 6.6 bcfd vs. 6.7 the prior week. LNG exports were 16.6 bcfd (a new record) vs. 16.2 bcfd the prior week.
European gas prices were most recently lower at $9.95/MMbtu equivalent despite storage reserves needing to be at 90% by Nov. 1, 2025. The EIA’s Weekly Natural Gas Storage Report indicated an injection of +57 Bcf. Total gas in storage is now 1.83 tcf, rising to 19.7% below last year and rising to 2.1% below the 5-year average.
Natural gas, technical analysis
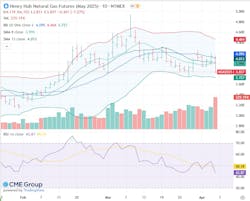
May 2025 NYMEX Henry Hub Natural Gas futures are now below the 8-, 13- and 20-day Moving Averages and sitting below the Lower-Bollinger Band mark, a BUY signal. Volume is at 155,000 after having set a record at 360,000 both Thursday and Friday. The RSI is still “neutral” at “40”. Support is pegged at $3.40 with Resistance at $3.6.
Looking ahead
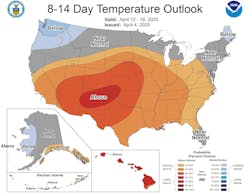
The next 8-14 days look bearish for natural gas demand however, May futures will benefit from continuing storage injections. Further out, the South Central US may start to see A/C load. LNG send-outs continue to increase which could help the demand picture for the Spring months.
About the Author

Tom Seng
Dr. Tom Seng is an Assistant Professor of Professional Practice in Energy at the Ralph Lowe Energy Institute, Neeley School of Business, Texas Christian University, in Fort Worth, Tex.


