Oil, fundamental analysis
Crude prices rose this week on an uptick in the geopolitical risk premium, promised stimulus packages in China, tighter sanctions on Russian exports, and another draw in feedstock inventories. On the flip side, OPEC cut its 2025 demand growth forecast for the 5th straight time while there was a substantial gain in US refined product stocks.
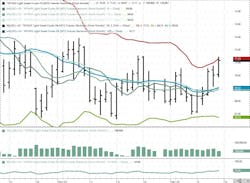
WTI has stair-stepped its way past the $71/bbl mark to a weekly high of $71.45 (Friday) while breaching the Upper-Bollinger Band limit of $71.33, a key technical resistance point. The low was Monday’s $67.05/bbl. Brent crude moved in a similar pattern with a weekly Hi/Lo of $74.30/$70.90. The WTI/Brent spread has tightened to -$3.70/bbl.
Oil markets continue to react to geopolitical events and the Chinese economy while seemingly switching focus daily. China has promised a new round of stimulus measures in 2025 including rate cuts as economic indicators still paint a bleak picture. November imports there fell 4% from the prior month.
The surprise overthrow of the Assad regime in Syria has added to the tensions in an already unsettled region as Iranian and Russian influence now come into question. The G7 has placed new sanctions on Russia’s “shadow” fleet of crude carriers and potential sanctions on Iran’s nuclear program have added more geopolitical risk to oil markets. However, India’s largest private refiner, Reliance, has signed the largest-ever crude oil supply deal with Russia’s Rosneft which amounts to 500,000 b/d over 10 years.
OPEC analysts and the International Energy Agency (IEA) in Paris have been at odds with their respective demand forecasts for most of this year with the latter taking a more bearish outlook than the former. So, it was interesting to see OPEC issue a bearish forecast for next year while the IEA increased theirs by 100,000 b/d to +1.1 million b/d. Meanwhile, the US Energy Information Administration (EIA) is calling for an increase in consumption of 1.3 million b/d and a more balanced 2025.
The EIA's Weekly Petroleum Status Report once again indicated that commercial crude oil inventories for last week decreased while refined product stocks increased. The Strategic Petroleum Reserve (SPR) gained 0.725 million bbl to 393 million bbl and US oil production rose 120,000 b/d to 13.63 million b/d vs. 13.1 last year at this time.
Inflation ticked up last month as the CPI rose to 2.7% from 2.6% in October. Meanwhile, the Producer Price Index for November increased 0.2% vs. October and is +3.0% for the trailing 12-months. The Federal Reserve is still expected to make another interest rate cut at next week’s meeting as these indexes were within expectations. Applications for unemployment benefits rose 17,000 to 242,000 last week vs. analysts calling for 220,000. The Dow and S&P are lower on the week while the NASDAQ is trading higher after setting a new record by topping the 20,000 mark for the first time ever. The USD is higher which may cap crude’s rally.
Oil, technical analysis
January NYMEX WTI Futures prices have shot past the 8-, 13-, and 21-day Moving Averages and the Upper-Bollinger Band limit, a Sell signal. Volume is about average at 200,000. The Relative Strength Indicator (RSI), a momentum indicator, is neutral at the 56 mark. Thirty or below is considered very oversold while 70 or above is considered very overbought. Resistance is now pegged at $71.50 with near-term Support at $71.15.
Looking ahead
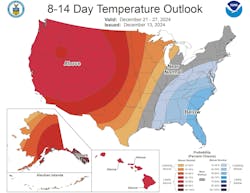
We now have a new geopolitical factor to consider with the successful rebellion in Syria. Traders will be focused on Iraq, Iran, and the new sanctions imposed on Russian Ural exports for actual supply disruption. The 8-14-day forecast indicates possible heating oil demand in the Northeast.
Natural gas, fundamental analysis
A higher-than-forecasted storage withdrawal this week that shrunk the year-on-year surplus pushed January natural gas prices to a 3-week high but a warmer outlook has lowered prices late week. January futures still managed to remain above the $3.25 mark.
The week’s High was $3.56/MMbtu on Thursday while the Low was Tuesday’s $3.07. Supply last week was +0.6 bcfd to 110.5 bcfd vs. 109.9 the prior week. Demand was 128.6 bcfd, down from 136.1 bcfd the week prior with the biggest decrease in residential usage. Exports to Mexico were 6.4 bcfd vs. 6.1 bcfd the prior week. LNG exports were 14.2 bcfd. vs. 14.5 bcfd the prior week.
European gas prices were lower this week on forecasts for warmer weather while EU storage levels now stand at 80% full. European natural gas prices were most recently at $12.35/MMbtu equivalent in the spot market and $10.35 for January delivery.
The EIA’s Weekly Natural Gas Storage Report indicated a withdrawal of 190 bcf vs. a forecast of -165 bcf and vs. the 5-year average of -71 bcf. Total gas in storage is now 3.747 tcf, dropping to 1.8% above last year and 4.6% over the 5-year average.
Natural gas, technical analysis
Looking ahead
Reducing the storage surplus that has existed for several months now will provide bullish support for natural gas prices when colder temperatures do occur. However, the next couple of weeks look bearish for demand except for the US SE and Middle Atlantic regions.
About the Author

Tom Seng
Dr. Tom Seng is an Assistant Professor of Professional Practice in Energy at the Ralph Lowe Energy Institute, Neeley School of Business, Texas Christian University, in Fort Worth, Tex.


