Oil, fundamental analysis
While crude markets await a further back-and-forth between Israel and Iran, technical signals dominated oil price moves this week. Panic selling started the session Sunday evening and bargain buying and lower inventory numbers spurred prices higher by week’s end. WTI saw a High/Low range of $71.45/bbl (Friday)/$66.70/bbl (Tuesday) while Brent’s range was $74.95/$70.70. The Brent/WTI has tightened to -$4.00/bbl.
Last Friday, oil traders took positions for the weekend, went home and just held their breath with an eye on Israel’s expected counterattack on Iran. With the market closed until last Sunday evening, prices were at the mercy of Israel’s pledge not to target Iran’s oil infrastructure. By Saturday, missile attacks on Iran happened and oil facilities were spared, which led traders to return to their prior concerns over demand.
The resultant “Open” on Sunday evening was $69.00/bbl, down from Friday’s Settlement of $71.75 and its low of $69.75, resulting in a “gap” on the technical charts. And, in the same way nature abhors a vacuum, technical traders expect these gaps to be filled eventually before the continuation of the current trend. The gap was filled on Thursday and prices marched up to the 21-day Moving Average where the move has stalled. Rumors are now rampant among traders that Iran will attack Israel leading to another counterattack on Iran by Israel which currently is the only price-supporting factor.
The Biden administration has approved the permit for the proposed Sentinel Midstream “Texas Gulflink Deepwater Port” which will be capable of exporting 1.0 million Bbld. while being able to load VLCCs (OGJ Online, Nov. 1, 2024).
The Energy Information Administration’s (EIA) Weekly Petroleum Status Report indicated commercial inventories of crude oil and refined products decreased across the board while oil production held steady at the 13.5-million b/d record level. An additional 1.2 million bbl was added to the Strategic Petroleum Reserve. The US rig count for last week was steady at 585 which is down 33 from last year.
September’s PCE, the Fed’s preferred measure of inflation, was +2.1% vs. the prior year and very close to the Central Bank’s 2.0 target. A meager 12,000 jobs were added last month as hurricanes and the port strikes stalled hiring and displaced workers. Meanwhile, the PMI came in at 46.5 vs. September’s 47.2. A reading below “50” is an indication of contraction in manufacturing. However, construction spending was +0.1% I September vs. a forecasted 0.0% change. The Dow is a little higher week-on-week while the S&P and NASDAQ are lower. The USD is off slightly which is helping to get oil prices elevated.
Oil, technical analysis
“Gap Theory” held true this week as December 2024 NYMEX WTI futures contracts stair-stepped up to fill Sunday’s hole in the charts. Prices have moved above the 8- and 13-day Moving Averages and right at the 21-day MA. Volume, shown in the second box, is rising at over 200,000. The Relative Strength Indicator (RSI) is neutral at the 48 mark. 30 or below is considered very oversold while 70 or above is considered very overbought. Resistance is now pegged at $71.45 (21-day MA). Near-term Support is $69.85.
Looking ahead
As crude traders wait for any Middle East developments, OPEC+ faces a tough decision in regard to its stated plan to increase output next month. No doubt, the release of the estimated +2.2 million b/d of spare capacity would sink prices further.
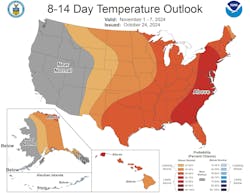
Finally, the tropics are showing late season activity with 3 systems being monitored. One, in the North-Central Atlantic, poses no threat to the US, while two others could impact the Gulf of Mexico. A trough of low pressure has formed near Puerto Rico and an active storm exists in the SW Caribbean Sea off Panama. Meanwhile, the first 2 weeks of November look to be bearish for heating oil consumption.
Natural gas, fundamental analysis
A storage surplus heading into winter and increasing production continues to suppress natural gas futures prices. In fact, $3.00 isn’t present for the November-March period. The week’s High was $2.92/MMbtu on Wednesday’s “roll” from November to December while the Low was Tuesday’s $2.20.
Supply last week was up 2.0 bcfd to 109.1 bcfd vs. 107 the prior week. Demand was 100 bcfd, up from 96.3 the week prior with increases in Residential usage and Power consumption. Exports to Mexico were 6.2 bcfd vs. 6.3 the prior week. LNG exports were 13.5 bcfd. vs. 13.7 the prior week.
The latest European natural gas prices were quoted at about $12.35/MMbtu despite storage levels at 95% full and mild weather.
The EIA’s Weekly Natural Gas Storage Report indicated an injection of 78 bcf vs. a forecast of +82 bcf. Total gas in storage is now 3.86 tcf, 2.8% above last year and 4.8% over the 5-year average.
With only 1 week left in the traditional injection season and, assuming an average build of 80 bcf, yearend storage totals could reach 3.94 tcf, a level seen very few times over the past 15 years.
Natural gas, technical analysis
Looking ahead
The transport agreement between Russia and Ukraine for natural gas flows will expire at yearend and the EU is still receiving some volumes from Russia. The expectation is that there will not be a renewal between the two countries, leaving the EU looking for supplemental supplies. The next 2 weeks don’t look positive for natural gas demand in the US as above-normal temperatures are forecasted.
About the Author

Tom Seng
Dr. Tom Seng is an Assistant Professor of Professional Practice in Energy at the Ralph Lowe Energy Institute, Neeley School of Business, Texas Christian University, in Fort Worth, Tex.


