Oil, fundamental analysis
Crude oil prices dropped this week to levels not seen in 4 years as the reent Trump tariff announcement cratered global markets while OPEC+ decided to more than double its previously stated output increases. A reported large inventory increase had only a minor impact on prices preceding the tariff press conference.
WTI’s High was $72.30/bbl Wednesday with the Low occurring on Friday at $60.45 which was down $11.25 from Wednesday’s settlement. Brent crude traded in a similar fashion with a High of $74.50 Wednesday while its Low was also Friday at $64.05. The Brent/WTI spread now stands at ($3.70). Both grades settled much lower week-on-week.
The week started out optimistically for prices as China National Petroleum Corp. (CNPC) forecasted an increase in demand there of +1.1% this year while the Energy Information Administration (EIA) indicated total US oil production was declining to near last year levels. Ever-tightening sanctions on companies producing Venezuelan crude also had a slightly bullish effect on prices.
The new set of tariffs announced after market Wednesday led to an immediate fall in global economic index futures overnight which spilled into Thursday’s regular trading sessions. Indices remained 'in the red' throughout the day across-the-globe. Oil prices tanked in tandem on demand growth concerns. Further exacerbating the downward spiral was the fact that the announced OPEC+ group output volume of +118,000 b/d was now going to be 411,000 b/d. China countered with 34% retaliatory tariffs on all US goods on Friday which led to further deterioration in financial and energy commodity markets.
The EIA's Weekly Petroleum Status Report indicated that commercial crude oil inventories for last week increased 6.0 million bbl to a total of 440 million bbl, rising to 4% below the 5-year average. The American Petroleum Institute (API) had forecasted a change of +6.0 million bbl while market analysts called for a drop of 700,000 bbl.
US refinery utilization dropped to 86% from 86.9% which represents a 190,000 b/d drop in inputs to 15.56 million b/d. Total motor gasoline decreased 1.6 million bbl to 237.6 million bbl, 2% above the 5-year average. Gasoline demand fell 150,000 b/d to 8.5 million b/d vs. 8.82 the week prior and 9.0 a year ago.
Distillates increased by 300,000 bbl to 114.6 million bbl, rising to 6% below the 5-year average. Inventory at the key Cushing, Olka., hub increased 2.3 million bbl to 25.1 million bbl, or 33% of capacity.
The Strategic Petroleum Reserve gained 285,000 bbl to 396 million bbl. Imports of crude oil were up 270,000 b/d to 6.5 million b/d vs. 6.2 the prior week while exports were 4.6 million bld vs. 4.64 the prior week.
Exports of petroleum products were 6.4 million b/d last week vs. 6.1 the prior week. Total US oil production held at 13.6 million b/d vs. 13.1 last year at this time. The US rig count fell by 2 last week to 590 vs. 620 last year at this time.
AAA’s average US retail gasoline prices at the pump were most recently reported at $3.268/gal.,
+0.111/gal. from last week, +0.17/gal. from last month, and +$0.20/gal. less than a year ago.
As if the impact of the new tariffs weren’t enough negative news this week, the ISM Manufacturing Index fell to 49 in March from February’s 50.3. And those calculating the odds of recession have moved that mark to 53%. All 3 major US stock indexes are considerably lower on the week over concerns that the trade wars will have a negative impact on both economic growth and inflation. The Dow has lost over 3,200 pts, the S&P is down 500 pts, and the NASDAQ is down 1,700 pts. The USD ended down week-on-week as well which some have regarded as an anomaly given the fall in equities.
Oil, technical analysis
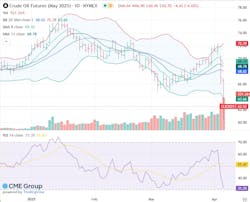
NYMEX WTI Futures have fallen well below the 8-, 13-, and 20-day Moving Averages, having breached the Lower-Bollinger Band limit. Volume set a new high at 520,000. The Relative Strength Indicator (RSI), a momentum indicator, is “very oversold” at the “31” mark. Resistance is now pegged at $63.65 (Lower-Bollinger Band) with near-term Support at $62.00.
Looking ahead
It’s anyone’s guess where we go from here. Have we seen the end of the Trump tariffs and the resultant retaliatory responses? Can the stock market and, thus, energy commodity markets rebound? Prices definitely “fell too far, too fast” and we should see some buying as a result. But the question remains as just how much we can recover and how soon. And it will take a few months to track OPEC+ output to see if they are all in compliance with their respective output allocations under the new volume guidelines.
Natural gas, fundamental analysis
US natural gas futures were not impacted as greatly by the tariff situation because storage volumes are low and traders are not yet betting against next winter. At week’s end, however, prices did succumb to the overall gloomy economic outlook and fell below the $4.00/MMbtu level. A High of $4.20/MMbtu occurred Thursday with the week’s Low of $3.80 printing on Friday.
Supply last week was down 0.5 bcfd to 110.1 bcfd vs. 110.6 the prior week. Demand was down 5.9 bcfd to 101.9 bcfd vs. 107.8 bcfd the week prior, with the biggest decrease coming in residential consumption.
Exports to Mexico were 6.7 bcfd vs. 6.2 the prior week. LNG exports were 16.2 bcfd vs. 16.4 bcfd the prior week. European gas prices were most recently quoted at $12.35/MMbtu equivalent as storage levels are at 34%. Reserves need to be at 90% by Nov. 1, 2025. The EIA’s Weekly Natural Gas Storage Report indicated an injection of 29 bcf vs. a 25 bcf forecasted increase. Total gas in storage is now 1.773 tcf, rising to 21.7% below last year and rising to 4.3% below the 5-year average.
Natural gas, technical analysis
May 2025 NYMEX Henry Hub Natural Gas futures fell late week and are now below the 8-, 13-, and 20-day Moving Averages. Volume set a new record at 229,000. The RSI is still “neutral” at “44”. Support is pegged at $3.73 (Lower-Bollinger Band) with Resistance at $4.00.
Looking ahead
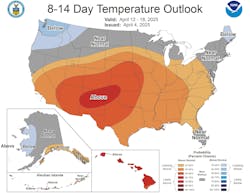
The next 8-14 days look bearish for natural gas demand however, May futures will benefit from continuing storage injections. The NW region of the US received below-normal snowpack levels which will reduce the Springtime run-off that fills the region’s rivers and reservoirs. A hot summer in the NW and California will now be bullish for natural gas consumption.
About the Author

Tom Seng
Dr. Tom Seng is an Assistant Professor of Professional Practice in Energy at the Ralph Lowe Energy Institute, Neeley School of Business, Texas Christian University, in Fort Worth, Tex.


