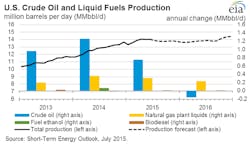
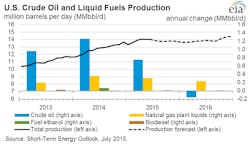
Total US crude oil production dropped 50,000 b/d in May compared with April and is expected to continue falling through early 2016 before growth resumes, according to the US Energy Information Administration’s Short-Term Energy Outlook (STEO).
The most recent production estimates indicate US output in April averaged 9.7 million b/d. Although total US production increased in April, the data indicate that onshore production began declining that month.
EIA estimates that in this year’s first half, US crude production averaged nearly 9.6 million b/d, up 300,000 b/d from average production during fourth-quarter 2014 despite a 60% decline in the total US oil-directed rig count since October 2014 (OGJ Online, July 2, 2015).
Declines are expected to continue into early 2016, when total production is forecast to average 9.2 million b/d during the first quarter. Production is forecast to begin rising in second-quarter 2016, returning to an average of 9.6 million b/d in the fourth quarter.
EIA notes that 13 projects are scheduled to come online in the Gulf of Mexico in 2015 and 2016, pushing production up 17% to 1.7 million b/d in fourth-quarter 2016 from 1.4 million b/d in fourth-quarter 2014.
Total US crude production is projected to average 9.5 million b/d in 2015 and 9.3 million b/d in 2016. The forecast for each year is 40,000 b/d higher than in last month’s STEO, reflecting upward revisions to estimated gulf production in the second quarter.
Global supply gains
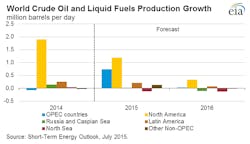
EIA estimates that production of petroleum and other liquids outside of the Organization of Petroleum Exporting Countries rose 2.3 million b/d in 2014, mainly reflecting US production growth. EIA expects non-OPEC production to rise 1.4 million b/d in 2015, but just 200,000 b/d in 2016.
After remaining relatively flat in 2015, production in Eurasia is projected to decline 100,000 b/d in 2016, reflecting reduced investment in Russia’s oil sector stemming from low crude oil prices and international sanctions.
EIA estimates that OPEC crude production averaged 30.1 million b/d in 2014, unchanged from the previous year. Production declines in Libya, Angola, Algeria, and Kuwait offset production growth in Iraq and Iran. EIA forecasts OPEC production to increase 600,000 b/d in 2015 and decrease 200,000 b/d in 2016. Iraq is expected to be the largest contributor to growth in OPEC production in 2015.
Global inventory builds
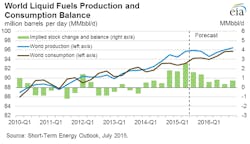
Global liquids production continues to exceed consumption, resulting in inventory builds estimated to have averaged 2.2 million b/d through the first half and projected to average 1.5 million b/d during the second half.
The slowing increases in inventory reflect rising demand and slowing production growth outside OPEC, particularly in the US. The expected inventory builds in 2015 are on top of an estimated 900,000 b/d increase in 2014. By 2016, inventory builds are expected to moderate to 600,000 b/d.
EIA estimates global consumption of petroleum and other liquids to have risen 1.1 million b/d in 2014, averaging 92.4 million b/d for the year. EIA expects global consumption of petroleum and other liquids to rise 1.3 million b/d in 2015 and by 1.4 million b/d in 2016.
Consumption by countries within the Organization for Economic Cooperation and Development of petroleum and other liquids, which fell 400,000 b/d in 2014, is expected to rise 400,000 b/d in 2015 and 300,000 b/d in 2016. Japan and Europe accounted for nearly all the 2014 decline in OECD oil consumption. The US is the leading contributor to projected OECD consumption growth in 2015, with consumption increasing by 400,000 b/d, while consumption in both the US and Europe increases by 100,000 b/d in 2016.
Consumption of petroleum and other liquids outside OECD countries rose 1.4 million b/d in 2014 and is projected to rise 800,000 b/d in 2015 and 1.1 million b/d in 2016.
Lower forecast growth for non-OECD consumption in 2015 mostly reflects a 200,000 b/d decline in Russia’s consumption as a result of the country’s economic downturn. Russia’s oil consumption is expected to decline by a similar amount in 2016, although it is offset by growth elsewhere. China remains the main source of non-OECD oil consumption growth, with a projected annual average increase of 300,000 b/d in both 2015 and 2016, down from growth of 400,000 b/d in 2014.
Crude prices mostly stable
North Sea Brent crude prices in June averaged $61/bbl, a $3/bbl decrease from May. Crude prices fell by about $4/bbl on July 6 in the aftermath of the “No” vote in Greece on the economic program, as well as lingering concerns about lower economic growth in China, higher oil exports from Iran, and continuing growth in global petroleum and other liquids inventories (OGJ Online, July 7, 2015).
EIA notes that a percent price change of this extent on a single day is unusual, but despite daily price volatility, monthly Brent crude prices have averaged between $55-65/bbl/month since falling to $48/bbl in January.
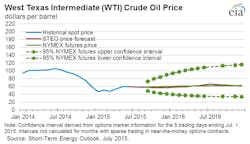
EIA forecasts that Brent crude prices will average $60/bbl in 2015 and $67/bbl in 2016. West Texas Intermediate crude prices in both 2015 and 2016 are forecast to average $5/bbl less than the Brent price. The current values of futures and options contracts for December 2015 delivery via EIA’s Market Prices and Uncertainty Report suggest the market expects WTI prices in December 2015 to range $41-89/bbl at the 95% confidence interval.
If a comprehensive agreement is reached on lifting sanctions on Iran, EIA estimates that the reentry of more Iranian oil could result in a $5-15/bbl lower baseline STEO price forecast for 2016.
