API: US petroleum demand increased nearly 9% in June
The recovery of US petroleum markets broadly continued in June with US petroleum demand increasing nearly 9% to 17.6 million b/d, according to data released July 16 in the American Petroleum Institute’s June 2020 Monthly Statistical Report (MSR).
“Although we have a long way to go for US petroleum markets to recover to pre-pandemic levels, the comeback broadly continued in June despite ongoing challenges with COVID-19,” API Chief Economist Dean Foreman said. “While we are not out of the woods yet, we do appear to be headed in the right direction with the US natural gas and oil industry well-positioned to play an important role in the recovery of the US and global economies.”
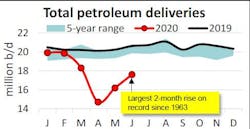
US petroleum demand, as measured by total domestic petroleum deliveries, was 17.6 million b/d in June. This was an increase of 8.7% (1.4 million b/d) from May but 14.6% (3.0 million b/d) below the level in June 2019.
The rebound in May and June amounted to 2.9 million b/d—the largest 2-month increase on record since 1963. Motor gasoline accounted for 85% of the increase as light-duty transportation resumed and also apparently benefitted from substitution for flying and public transit as states re-opened from the COVID-19 pandemic.
Consumer gasoline demand, measured by motor gasoline deliveries, was 8.3 million b/d in June. This was 14.1% (1.4 million b/d) below its level in June 2019. Boosted by state re-openings, the summer driving season (with less flying), and low prices, gasoline demand increased by 14.0% (1.0 million b/d) from May and marked the largest 2-month rise (2.5 million b/d) on record since 1945. US average conventional gasoline prices averaged $2.17/gal in June, down by 22.6% ($0.63/gal) from June 2019, according to AAA.
In June, distillate deliveries of 3.5 million b/d rose by 5.7% (200,000 b/d) from May but remained down by 11.6% (500,000 b/d) compared with June 2019. This was consistent with reported improvements in trucking freight volumes.
Kerosene jet fuel deliveries were 700,000 b/d in June and marked their first monthly increase in 2020—+41.2% between May and June, consistent with reported flight activity rising per Flightradar24. However, jet fuel volumes still were down by 61.3% y/y as passenger traffic has remained weak amid the COVID-19 pandemic.
Deliveries of residual fuel oil, which is used in electric power production, space heating, industrial applications and as a marine bunker fuel, were 230,000 b/d in June. This marked a 29.7% y/y decrease, consistent with industrial activity that remained relatively weak combined with less marine bunker fuel demand due to IMO 2020 implementation.
Deliveries of liquid feedstocks, such as naphtha and gasoil (other oils) used in refining and petrochemical manufacturing, were 4.8 million b/d in June. This was an increase of 0.9% y/y, but reflected the second consecutive month of annual growth well below pre-COVID-19 levels that trended near 6.0% y/y.
In June, West Texas Intermediate (WTI) crude oil prices rose to $38.31/bbl, which was a record increase of 131% ($21.76/bbl) since April. However, WTI prices remained down 29.9% y/y.
By comparison, Brent crude oil spot prices averaged $40.27/bbl in June, up by 119% ($21.89/bbl) since April. As oil prices have risen over the past 2 months, the Brent-WTI price differential widened $1.96/bbl in June – on par with the average since 1995, adjusted for price inflation.
In futures markets, expectations after the recent oil price rebound appeared tepid, as WTI price futures at the end of June reflected only a 2.7% increase within 12 months per data from CME Group.
In June, US crude oil production fell to 11.0 million b/d, a decrease of 400,000 b/d from May and 1.9 million b/d from the peak in November 2019. June marked the 7th consecutive monthly decline, consistent with oil-directed drilling activity (196 rigs in June) having fallen to its lowest levels since June 2009. By comparison, US natural gas liquids (NGL) production of 4.7 million b/d in June fell by 1.4% m/m. NGLs are a co-product of natural gas production that EIA estimates fell by 1.1% in June.
In June, US petroleum imports were 8.7 million b/d in June, up 1.2 million b/d from May. Preliminary crude oil import data from EIA showed the largest June increase being sourced from Saudi Arabia, which may reflect a delayed remnant of OPEC’s brief price war in March and April.
By contrast, US petroleum exports of crude oil and refined products were 7.4 million b/d. This represented an increase of 2.8% (200,000 b/d) from May but a decrease of 14.0% (1.4 million b/d) compared with June 2019. Within the total exports, 4.7 million b/d was refined products and rose by 600,000 b/d m/m. The remainder was crude oil exports that fell by 400,000 b/d from May. On net, the US was net importer of 1.3 million b/d petroleum in June, the highest level since July 2019.
US refinery throughput of 14.2 million b/d implied a capacity utilization rate of 74.7% in June. Refinery throughput increased by 5.8% or 800,000 b/d from May, while capacity utilization rose by 4.1 percentage points. Although the absolute levels of throughput and capacity utilization remained historically low, the monthly increases in both metrics were the largest on record for the month of June.
US total petroleum inventories, including crude oil and refined products but excluding the Strategic Petroleum Reserve, were 1.40 billion bbl in June and accumulated y/y for the 20th consecutive month. This level was slightly below the record set in April for the highest inventories for any month since 1956.
Crude oil stocks reached a new record 538.8 million bbl despite the slower production and increased refinery throughput, suggesting pressure has remained on production.
