3-D pipeline spatial data advances design, operation
Zhenpei Li
Southwest Petroleum University
Chengdu, China
Jinfei Wang
University of Western Ontario
London, Canada
Robert Brook
Novara GeoSolutions
Norwell, Mass.
Penghui Ren
Second Pipeline Construction Co. of
China National Petroleum Corp.
Xuzhou, China
Testing of data provided by the Second Pipeline Construction Co. of China National Petroleum Corp. (PetroChina Pipeline) shows that using a 3D pipeline spatial-data model (PSDM) not only can further pipeline information management but also aid design and operation. The Pipeline Open Data Standard (PODS) provided the data-testing framework.
Pipeline geographic information systems (GIS) provide crucial decision support across a pipeline system's life cycle, including design, construction, and operation. But most pipeline GIS are 2D, limiting their management role. Demand for 3D GIS technology and applications, however, is growing, driven by areas such as pipeline integrity management, visual pipeline design and management, immersive pipeline industry training, online and offline simulating, and remote supervision and control.
Prospective applications include:
• Design, optimization of new-construction pipeline systems.
• Creation of an interactive virtual pipeline.
• Detailed online and offline simulation.
• Reduction of training cost and time.
• Combining with supervisory control and data acquisition (SCADA) in a networked environment to provide visual remote control.
Pipeline data play a fundamental role in pipeline system management. Incomplete data may lead to uncertain or even faulty assessment results. Pipeline data consists of three types generated throughout the pipeline life cycle: survey and design data, construction data, and operational data. These data cover all aspects of pipeline management, including location, geographic features, intelligent in-line inspections, physical inspections, maintenance, operation, cathodic protection, risks, and damage events.
Pipeline data come from multiple sources, are voluminous, and continually increase with time. Most contain geospatial information. Effectively gathering, organizing, and storing these data, while providing GIS support and meeting the needs of different pipeline companies, is an increasingly urgent task.
A pipeline data model formulates the primary structure and behavioral characteristics of pipeline data. It involves behaviors and events that occur during the entire pipeline life cycle as well as information regarding the pipeline's external environment. Most pipeline data models account for the spatial features of pipeline data. The relationship between pipeline spatial data and attribute data is also described in pipeline data models, providing a framework for gathering, organizing, and managing pipeline information.
The roles and benefits of data models for pipeline management include:
• Providing a uniform data structure, database, and comprehensive data inventory.
• Improving data accuracy, consistency, and integrity.
• Efficiently managing pipeline data in an ordered, centralized, and interrelated way.
• Easily updating pipeline data.
• Continually providing high quality and reliable data for pipeline management.
• Providing interoperability between pipeline companies and better support of integration activities, and promoting data sharing with industry-standard data models.
• Sharing experiences and practices with other companies.
• Implementing and customizing pipeline systems and problem solutions based on individual needs.
• Providing spatial support for GIS implementation.
• Reducing cost, time, and complexity of GIS implementation.
A robust, industry-standard pipeline data model will benefit the whole pipeline industry. A 3D pipeline spatial-data model should be the first step in developing a 3D pipeline application.
Web-based 3D application
Web technology has been an effective means of developing distributed pipeline management systems. With web-based pipeline GIS, pipeline companies are able to distribute, manage, inquire, analyze and share pipeline information. With web-based 3D GIS, a visual oil and gas pipeline management system can be created and deployed on the internet to improve pipeline management efficiency. A well-designed 3D pipeline spatial data model is the first step in developing such pipeline management systems.
Pipeline systems are not isolated. They need to integrate with other information systems. Information integration is driven by data interoperability. After more than 10 years of development, the Pipeline Open Data Standard (PODS) has come to realize the importance of data interoperability. PODS Association and Open Geospatial Consortium (OGC) have signed a liaison agreement to work together to identify enhancement opportunities between the PODS standard and data model and the advanced geospatial interoperability concepts developed within OGC's consensus standards process.1
A 3D PSDM as a step towards web application provides an architecture for 3D pipeline data storage and management. It also provides the ability to deploy 3D pipeline GIS on the internet, lowering the cost and time required to implement a 3D pipeline GIS and improving data accuracy, consistency, and integrity.
Model design
Objectives of 3D PSDM include:
• Providing a robust pipeline data architecture for 3D pipeline data storage and management.
• Providing a foundation for developing 3D web-based pipeline GIS.
• Easily integrating with current widely used pipeline data models including PODS, ArcGIS Pipeline Data Model (APDM)-now Utility and Pipeline Data Model (UPDM)-and Integrated Spatial Analysis Techniques.
Design principles of the 3D pipeline spatial data model include:
• Starting with current widely used pipeline data models.
• Supporting linear reference and dynamic segment technology.
• Proving extensibility and flexibility.
• Supporting 3D data interoperability.
• Being robust, practical, and easy to implement.
Considering wide use of PODS and other pipeline data models, 3D-PSDM design used them as a starting point from which to develop a 3D model both independent of current prevalent data models and able to be integrated with them. Design also used Pipeline Digital Elevation Model (Pipeline-DEM) raster datasets to provide the groundwork for display of visible pipeline elements. Additional raster datasets (DEMImages) provided 3D terrain model texturing.
Web3D toolkits allowed encoding, rendering, and deploying 3D pipeline models on the web. A data field called "3D_description" was appended to the class or table of current geometry-containing pipeline data models.
The 3D_description field stores code segments and descriptions (formatted by a chosen Web3D technology) for pipeline and facilities 3D models according to their actual parameters. For example, centerline is modeled using ID, OD, and length; control points using XYZ coordinates; etc. Pipe-bend modeling uses actual radius, vertical angle, horizon angle, etc. These code segments for 3D models are initially stored in the server for later download to a client.
Another data field called "Texture" contains images used to texture the corresponding pipeline elements.
Current pipeline data models use a horizontal distance to depict the relation between two pipelines, or between other equipment and the pipeline centerline. A 3D pipeline data model is more complex. Several fields will be added to specific tables to describe the direction and relation between two pieces of pipeline equipment.
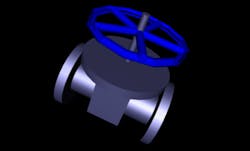
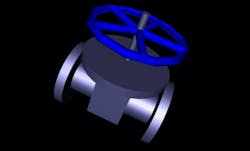
Fig. 1 shows a hand wheel installed on a valve body, each counted as two distinct pieces of pipeline equipment. Four additional data fields will be added to the Handwheel table for this figure: OffsetX, OffsetY, ZDistance, ValvebodyID.
OffsetX specifies the distance between the hand wheel and valve body's center of mass against the valve body's axis. OffsetY specifies the distance between the hand wheel's center of mass and the valve body along the valve body's axis. ZDistance specifies the vertical distance between the hand wheel's center of mass and the valve body along the Z direction. ValvebodyID specifies with which valve body the hand wheel will be installed. The extra fields allow rendering the 3D hand wheel model in a specific location on the valve body in 3D space.
Implementation
A typical 3D-PSDM implementation roadmap includes:
• Choosing an existing model as the pipeline data framework, and then loading custom pipeline datasets, without necessarily completing full 2D GIS implementation.
• Choose a preferred Web3D technology as a 3D pipeline modeling and rendering tool and an open standard technology if interoperability is a concern.
• Loading PipelineDEM raster datasets with your chosen Web3D technology and selecting the corresponding geographic coordinates system to create the 3D terrain models, preparing a 3D reference space for the 3D pipeline models, texturing them with remote sensing images if necessary.
• Writing codes for the 3D_description field of a pipeline element using chosen Web3D technology, loading this 3D pipeline element model, and rendering it in the created 3D referenced space according to its location information when time to display it, texturing the object with prepared images if necessary.
Working with open standard technologies ensures data interoperability, minimizies data transfer between software applications or multiple databases, promotes data reliability and conciseness, and lowers cost and time, while at the same time allowing for customization.
We chose PODS because it is intended to be a pipeline industry standard and has been widely supported and used. PODS is collaboratively developed and maintained by PODS Association members. PODS Pipeline Data Model provides a highly scalable database architecture to integrate critical records and analysis data with geospatial location for each component of a pipeline system in a vendor-neutral platform. Its pipe-centric approach to managing pipeline data helps operators collect, verify, manage, analyze, update, maintain, and deliver all the information about their pipelines quickly and reliably to applications and end-users.2
PODS latest model is modular, organized into functional groups that can be deployed independently.3 The only required module is the core module that maintains the information necessary to describe the pipeline centerline. Additional modules can be chosen as needed to support specific functional requirements.
This project used Extensible 3D (X3D) as the development toolkit for 3D pipeline modeling, including creating the 3D terrain model, building the 3D pipeline and facilities model, and rendering 3D scenes. There are many options for web-based 3D modeling technology, including WebGL, Collada, XML3D, and ThreeJS. We chose X3D is because it used XML as the encoding format to organize 3D scene graphs, which lay the foundation for 3D pipeline-data interoperability. It can also interact with the external applications needed to create an interactive 3D pipeline GIS.4
X3D is a royalty-free open standards file format and run-time architecture to represent and communicate 3D scenes and objects using XML. It is an ISO-ratified standard that provides a system for storage, retrieval, and playback of real-time graphics content embedded in applications, all within an open architecture to support a wide array of domains and user scenarios.5
Fields, images
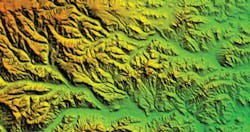
Building the 3D model using PODS required appending the fields "3D_description" and "Texture" to specific data tables. Other fields were optional. Appending PipelineDEM tables and DEMImages to the PODS model, loading raster datasets, and using X3D Geospatial components creates 3D terrain models and textures them with corresponding remote sensing images. Surrounding models such as trees, ground, walls, and buildings were also created in this step. Fig. 2 shows the 3D terrain model created by DEM raster datasets using X3D Geospatial components.
Three-dimensional terrain models commonly contain a huge quantity of geospatial data. This project used a level-of-detail (LOD) algorithm6 to avoid the storage and transfer-time problems associated with such large files. LOD is a technology used for 3D computer simulation displays. LOD generates several levels of 3D terrain model in the server in advance, using the quadtree algorithm. The multiple levels of detail can then be switched depending on whether the user is closer or further to a specific range.
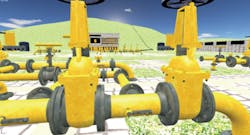
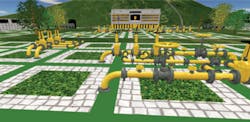
LOD technology improves render speed, reduces computer resource cost, and achieves an effect approximating the actual visual situation. Figs. 3-4 show a 3D-PSDM implementation done using data from PetroChina Pipeline.
The PetroChina data are for a compressor station and its surroundings. Development tools used included:
• Microsoft Visual Studio 2010.
• Java Development Kit 1.6.
• Microsoft SQL Server 2008.
• Internet Information Servers (IIS).
• ArcGIS for Server 10.2.2, used to create 2D pipeline GIS to verify the 3D-PSDM implementation.
• PODS.
• BS Contact, used as a plug-in to render and display 3D pipeline scenes in the web pages.
• Blender, used to create decorative 3D models, such as trees, which are not a part of the 3D-PSDM.
• Xj3D, used to write application for the interaction between 3D pipeline scenes and external applications.
• Extensible 3D (X3D), used to create 3D models for the elements defined in the 3D-PSDM.
• X3D Edit 3.3.
The pipeline data used for the 3D-PSDM implementation included:
• DEM for the selected area; 1-m resolution, UTM WGS84 coordinate system.
• Dimensions, measures, and locations of trees, lamps, walls, and the only building in the area.
• Attributes of equipment such as launchers, receivers, manifolds, valves, flanges, meters and instruments, tees, taps, elbows, pipes, flow computers, pig pass indicators, and tanks.
• Detailed pictures of the area including terrain, surroundings, building, trees, walls, lamps, and outside facilities (taken from several angles and places).
The accompanying table shows the valve's raw record.
This study's implementation of 3D PSDM used PODS as the starting point, placing data into six separate PODS modules: the core module, the operations module, the off-line features module, the offline compression module, the product transport features module, and the attached features module.
The data used can be classified as three types:
• Data that can be targeted into corresponding tables defined in the 3D PSDM; e.g., DEM (corresponding to the PipelineDEM table), parts of pictures (corresponding to DEMImages and the Texture table), and launcher, receiver, elbow, flange, tap, tee, valve, tank, compressor station, and structure data (corresponding to the tables with the same names).
The 3D PSDM is simple for these data, requiring just loading their attributes into the corresponding tables according to pre-defined fields in each. X3D code will be created using each item's actual attributes including size, dimension, shape, model, and specification, then loaded into the 3D_description field.
• Data that cannot be targeted into corresponding tables defined in the 3D PSDM but that still belong to pipeline system elements. These data include manifold, bypass pipe, intake pipe, outlet pipe, flow computer, pressure controller, and pig pass indicator information and use the 3D PSDM's extensibility feature. The design principles and schema of the 3D PSDM were used to design new tables to accommodate these data and append them to the 3D PSDM.
• Data surrounding elements that do not belong to the pipeline system, such as trees, walls, lamps, and a part of pictures. The open-source software Blender used some of the data to create 3D scenes as background and decorated elements for the 3D system. Others verified the 3D pipeline scenes.
Results of implementing the 3D PSDM included:
• An indication that 3D PSDM is a well-designed and easy-to-implement model.
• Uniform, ordered, interrelated, and consistent storage of both 2D and 3D pipeline data.
• An indication that the technical map-making is feasible.
• The ability to see pipeline data in 3D form, providing a completely different way to manage it. For example, system data can be found and checked simply by visually roaming the 3D pipeline scenes, clicking the component in question, and making any changes necessary.
• Reduced errors.
• Easier access. The 3D pipeline system is deployed on the internet. Users can access the system whenever they connect to the internet.
• A firm foundation for 3D pipeline data interoperability, based on adopting the open-standard Web3D technology, X3D.
The well-designed 3D PSDM provided a uniform architecture for 3D pipeline data storage, organization, and management, in which both 2D and 3D pipeline data could be stored in an interrelated, consistent database. Feasible technical roadmaps allowed raw pipeline data to be turned into the 3D PSDM via a predefined smooth, step-by-step workflow.
Taking PODS as the starting point when implementing the 3D PSDM provided a comprehensive pipeline data inventory that made its implementation much easier. The open-standard Web3D technology X3D enabled deploying 3D pipeline scenes on the internet and laid a firm foundation for 3D pipeline data interoperability.
The extensibility design concept enabled pipeline companies to add new tables to the 3D PSDM to meet custom needs. Applying LOD technology for large 3D pipeline dataset improved display performance of 3D pipeline scenes in a networked environment.
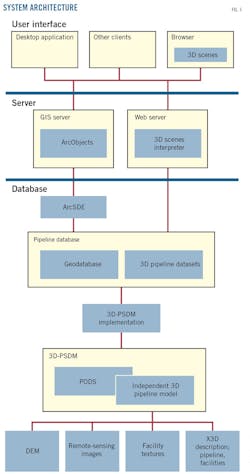
Fig. 5 shows system architecture and implementation roadmaps.
Acknowledgments
The authors would like to thank Mitacs and Novara GeoSolutions, a CHA Company, for their financial support. Novara GeoSolutions is a member of both PODS and APDM Associations. The University of Western Ontario and Gryphon, a CHA Company, provided research facilities and resources. The authors would also like to thank Emily Villanueva at University of Western Ontario for her contribution to this paper.
References
1. "PODS-OGC Collaboration Designed To Help Operators," Pipeline & Gas Journal, Vol. 241, No. 3, March 2014.
2. PODS Association, "What is the PODS Pipeline Data Model?" http://www.pods.org/pods-model/what-is-the-pods-pipeline-data-model/
3. Sinclair, J., "Linking data to get the full picture," World Pipelines, Vol. 13, No. 1, January 2013, p. 34.
4. Web3D Consortium, ISO/IEC 19775-2:2010/DIS, "Information technology - Computer graphics and image processing - Extensible 3D (X3D) - Part 2: Scene access interface (SAI)," http://www.web3d.org/standards.
5. Web3D Consortium, ISO/IEC IS 19775-1:2013 2:2008, "Information technology-Computer graphics, image processing and environmental representation - Extensible 3D (X3D)-Part 1: Architecture and base components," http://www.web3d.org/standards.
6. Danovaro, E., De Floriani, L., Magillo, P., Puppo, E., and Sobrero, D., "Level-of-detail for data analysis and exploration: A historical overview and some new perspectives," Computers & Graphics, Vol. 30, No. 3, June 2006, pp. 334-344.
Based on presentation to the Pipeline Technology Conference, May 23-25, 2016, Berlin.
The authors
Zhenpei Li ([email protected]) is a Mitacs Elevate postdoctoral fellow in the department of geography, University of Western Ontario, London, Canada. He has an MS in mechanical engineering and a PhD (2011) in control science and engineering, both from Northwestern Polytechnical University, Xi'an, China. Li has been a lecturer at the school of civil engineering and architecture, Southwest Petroleum University, Chengdu, China since 2011. He has more than 8-years' experience in oil and gas pipeline research and application, especially in pipeline data modeling.
Jinfei Wang ([email protected]) is a professor in the department of geography at University of Western Ontario. She received BS and MS degrees from Peking University, Beijing, China, and a Ph.D in geography from University of Waterloo, Ontario, Canada. Wang's research interests focus on methods and applications of remote sensing and GIS, including information extraction from high-resolution remotely sensed imagery.
Robert Brook ([email protected]) is vice-president of sales, marketing, and strategic development at Novara GeoSolutions, a CHA Company. Previous roles include senior director of Pacific Gas and Electric Co., member of the PODS board of directors, and global pipeline and gas utility industry manager for Esri. Brook received a BS in geography and botany (1992) from the University of Calgary, Alberta, Canada.
Penghui Ren ([email protected]) is an engineer at the Second Pipeline Construction Co. of China National Petroleum Corp. He received an MS in control science and engineering (2011) from Liaoning Shihua University, Fushun, China. Ren has extensive experience in many aspects of long-transmission gas pipeline construction and management, including pipeline construction project management, on-site survey and inspection, construction plan formulation, and construction arrangement and organization. He is also responsible for pipeline construction survey data acquisition, pipeline commissioning and operation, pipeline completion acceptance, and mileage calculation of pipeline markers such as mileage posts, turning points, cross strakes, and warning signs.
