Direct hydrocarbon detection by wavelet energy absorption
WAVELET ENERGY ABSORPTION—1
The quest for the reliable direct detection of hydrocarbons from seismic data is probably as old as seismic data processing and interpretation itself.
Over the years a few different methods have been developed. But it seems that most, if not all, of the approaches are going along the same line of thinking.
The attention is primarily focused on studying in greater and greater detail the properties of the sound-reflecting boundaries present in the earth's interior. These methods are founded on the existing theoretical conclusions and experimental observations that the strength of the sound reflection (or acoustic impedance (AI) contrast) from the boundary itself is determined by certain lithological properties of rock within the layer above and the layer below this boundary.
When the experiment deviates too strongly from the theory, this deviation is usually attributed to noise, and many statistical and averaging methods are utilized to make a better fit between theoretical assumptions and existing experimental data. When it is not possible to get enough information about the reflection-boundary from seismic data itself, or this information is proved to be unreliable, then "outside" pieces of information (such as well logs, forward modeling, etc.) are imported into the process.
While admiring the tremendous amount of human thought and effort invested into this direction and acknowledging the overall contribution of the accumulated experience into the solution of the problem of direct detection of hydrocarbons, we would like to contemplate an alternative approach which we call wavelet energy absorption (WEA).
WEA framework
The heart of the WEA approach is to completely remove the properties of the reflecting boundaries from the analysis and to concentrate on studying the absorptive properties of rock encoded into the nonstationary wavelet propagating through the substrate.
So, how does this new approach help? What new information can we extract from seismic data by approaching the problem from this point of view? Before answering these questions, we review the history of analysis of seismic data for hydrocarbons.
It all began with bright spot analysis. If there is strong reflection amplitude, then there is gas! Then we learned that this is not always the case. Then we learned that in quite a few reservoirs it's definitely not the case. So, what's next?
Next came amplitude vs. angle (AVA) analysis. Now we know that:
1. An increase of amplitude with the angle of incidence could indicate gas;
2. A decrease of amplitude with the angle of incidence could indicate gas; and
3. In general, once we knew there was gas at a target location, we could develop an understanding of the corresponding AVA anomaly—but unfortunately, not vice versa, because in practically any data set there are many more AVA anomalies than gas fields.
To assist in the task of discrimination between "true" and "false" AVA and bright spot anomalies (or anomalous acoustic impedance values) additional information was needed. Well logs were an obvious place to turn, because of their availability and resolution.
The idea was that various types of log information (e.g., P-wave velocities, S-wave velocities, acoustic impedance inversion constraints) could be extrapolated along the reflecting boundary away from the well bore. Hence, model-based AVA and inversion solutions were developed (with some success) to better understand the "ground truth" of hydrocarbon reservoirs. Thus came seismic inversion.
However, all approaches that use well data have the same subtle and all too often critical and expensive weakness. When we combine well data with seismic data, inherently we make assumptions based on the well data that are then extrapolated away from the well bore.
Where the assumptions are valid, the result can be enhanced. On the other hand, where the assumptions are invalid, the result will by definition be worse than if no well data had been used! The critical issue however, is that as we move away from the well bore carrying our assumptions with us, we have no way to know at what point they break down.
Looking backwards, we see an evolution (bright spot = >AVA & inversion) toward attempted increased precision and reliability by using additional information to analyze largely the same thing: the properties of the reflecting boundaries!
No doubt, the reflecting boundaries "reflect" the lithologic properties of the layers above and below. But they also have their own properties, (e.g., curvature, dip, rigidity, tuning) embedded into their overall response to sound, that obscure and distort the sound wave variations caused by pure lithology. Nonetheless, reflectivity provides a glimpse into the reservoir, but this view sometimes greatly deviates from the "true" picture.
And to further complicate the matter, consider the following known fact about the nature of subsurface geology. Because the compaction ratios of sand and shale are different, the acoustic impedance (AI) contrast between them may disappear within a certain depth or age range (Fig. 1). This limits the area of applicability of approaches based on AI contrast (e.g., amplitude or bright spot, AVA, and inversion).
Lastly, there is an unavoidable point in common between amplitude, AVA, and inversion. Each of these methods attempts to understand the media under investigation (i.e., reservoir rock) by analyzing the interplay on amplitude of seven variables at points along the reflector of interest (i.e., P-wave velocity above, S-wave velocity above, density above, P-wave velocity below, S-wave velocity below, density below, and angle). We submit that this is obviously less direct than would be preferable given a better alternative.
In light of these known limitations, consider what's next? Perhaps it makes sense to continue to refine the AI contrast based methods to involve more and more information from sources other than seismic. But these approaches are extremely complex and often result in less reliable and more "interpretive" results.
Currently available methods include "supervised" vs. "unsupervised" trained neural networks that combine large numbers of attributes in an attempt to construct a meaningful reservoir model. There are also inversion-based approaches that combine well data, geophysical data, geologic data, reservoir engineering data, and geostatistical data in the hope of a more meaningful reservoir model.
These approaches have grown ever more complex (and expensive) involving more and more professionals from different disciplines in a chain that can be as strong as its weakest link.
Now, there is an alternative. We can directly study the changes to the traveling sound wave caused by the subsurface lithology in general, and by hydrocarbon reservoirs in particular. To achieve this we need to remove the reflectivity function from the recorded signal.
From this point of view the reflection is used only as a carrier of the sound wave back to the surface where it is recorded at the geophone location. Once the signal is recorded, the reflectivity function is no longer desirable because it distorts the lithologic information encoded into the sound wave.
Surprisingly, the task of separation of the recorded signal into reflectivity- and lithology-response is relatively easy to accomplish and does not require any knowledge about the properties of the reflective boundaries and their locations. What it does require, however, is a different point of view on the wave propagation phenomenon and, in particular, the nature of the seismic energy absorption.
Changing the point of view
When seismic wave W(w) propagates through the substrata, the earth reacts to this wave.Since the earth is not very smart, it reacts simply by multiplying the incoming wave by the coefficient R(w), which depends on the frequency w; of the incoming wave. So, the signal T(w), recorded at the geophone location, is the product of both functions:null
Equation 1 is one of the possible expressions for a convolution theorem. R(w) is the reflectivity function and W(w) is usually called a wavelet.As we discussed above, the information about the lithology is encoded into the unknown wavelet W(w). The unknown reflectivity function R(w) is also affected by the lithological properties of earth above and below the reflective boundary. But unlike the lithological information embedded into the wavelet, the lithological information encoded into the reflectivity function is masked by the properties of the boundary itself.In order to extract the wavelet from the known recorded signal T(w), we need to have some factor that would allow us to distinguish the wavelet from the reflectivity function.Usually the following assumptions are made about the wavelet and the reflectivity function:
1. The wavelet signature corresponds to the source of energy (dynamite, vibroseis, etc.).
2. The wavelet is stationary, i.e., the wavelet is not changed by the substrata during its propagation through the earth. This assumption implies that the changes of the wavelet by the earth's lithological properties are ignored.
3. The wavelet is a minimum phase-lag. This means that the phase-spectrum of the wavelet is completely defined by its amplitude-spectrum.
4. The reflectivity is the random (white) function.
The purpose of the above assumptions is to be able to extract the wavelet from the signal by some kind of signal averaging.
For example, the average of the random reflectivity function is zero. This assumption helps to extract the minimum phase-lag stationary wavelet from the recorded signal.
But the physical validity of these assumptions is highly questionable. To start with, the wavelet is significantly changed by the earth properties. In particular, even if the source signature is close to minimum phase-lag (dynamite) or to zero phase-lag (vibroseis) function, it is almost immediately transferred into a mixed phase-lag function by the near-surface eroded (weathering) layer.
The assumption that the reflectivity function is random is also not valid. In fact, the reflective boundaries are well organized in space.
So, again, the wavelet is changed during its propagation through the substrata. The reason for this change is the lithological properties of earth. In particular, part of the wavelet energy is absorbed. The rate of absorption depends on the frequency.
What's amazing is that the wavelet energy absorption itself can be used as a discriminating factor in order to separate the recorded signal into the wavelet and the reflectivity function.
Let's consider the simplest possible form of the propagating wavelet including the spherical divergence (1/t2) term and the energy absorption (e–βt) term:
null
where b is the energy absorption coefficient, and t is the measurement time.
As proven in Lichman 2001,1 the smoothness S of the amplitude spectrum of the wavelet in expression (2) is equal to half of the energy absorption coefficient.
null
In general, the smoothness of the amplitude spectrum of the wavelet is proportional to the energy absorption coefficient.
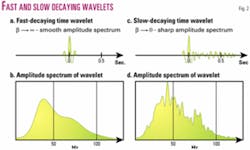
To illustrate this point, consider the fast-decaying wavelet shown in Fig. 2a and the slow-decaying wavelet shown in Fig. 2c. As can be seen, the amplitude spectrum of the fast-decaying wavelet in Fig. 2b is considerably smoother than the amplitude spectrum of the slow-decaying wavelet in Fig. 2d. Note that the frequency bandwidth of both wavelets spectrum (b) and (d) is the same (0-150 hz).
On the other hand (as proven in Lichman 1999,2 the smoothness of the reflectivity function is inversely proportional to the square of the recording time.
null
So, now we have the discriminating factor. The recorded signal in equation 1 is not just a product of two unknown functions but the product of the relatively smooth spectrum of the wavelet and the relatively sharp spectrum of the reflectivity function. In general, the ratio of smoothness is proportional to the product of the absorption coefficient and the square of the recording time:
null
Of course we cannot control the unknown absorption coefficient, but we can increase the smoothness separation by increasing the recording time.
Note that in derivation of the smoothness separation criterion, the only assumption used is that the wavelet is attenuated by the earth during its propagation through the substrata (equation 2). The rest is based on the analysis of the physical process of the wave propagation phenomenon itself.
From here, the extraction of the wavelet from the recorded signal is a straightforward process. As described in Lichman,1 2 the spectrum of the signal is transformed into the "smoothness-domain" (or real cepstrum). In this domain, the smooth wavelet is localized around the origin (infinite smoothness) whereas the sharp reflectivity function goes towards the edge (zero smoothness). Then the wavelet extraction in the smoothness-domain is equivalent to the extraction of certain smoothness range around the origin (Fig. 3).
The quality and the stability of the extracted wavelet depend on the smoothness separation criterion (equation 5) and is primarily a function of the recording time. For the typical seismic recording time of 3.0 sec (Fig. 4), the separation zone is very long (in excess of one third of the length of the entire smoothness-domain).
Since the random noise is the sharpest component of the amplitude spectrum, in the smoothness-domain it is mapped far from the origin along with the reflectivity function (Fig. 4). Hence, the extracted wavelet is practically insensitive to the random noise.
It is very important to understand that the extracted wavelet is not the source signature wavelet. Of course it is generated by the source, but then it is changed by earth and recorded at the geophone location. Therefore, it contains the characteristic of both; the source and the receiver (geophone) as well as all (including surface-related) multiple reflections generated along its propagation path though the substrata.
To distinguish this wavelet from the source wavelet, we call it the forward wavelet (forwarded or transmitted from source to receiver). Since the wavelet extraction algorithm based on the smoothness separation criterion is capable of extraction of the mixed phase-lag wavelet, we call it the phase inversion deconvolution (PID).
Due to the fact that the forward wavelet contains both source and receiver characteristics, the deconvolution with this wavelet is automatically surface-consistent.
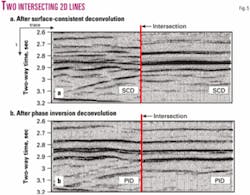
In an example of the surface-consistent properties of the PID algorithm (Fig. 5), two intersecting lines recorded at different vintages and different source-, and receiver-characteristic are processed using the conventional surface-consistent deconvolution (a) and the PID algorithm (b). The only difference in the processing sequence is the deconvolution algorithm. It is easy to see that the application of PID results in almost perfect tie at the intersection point.
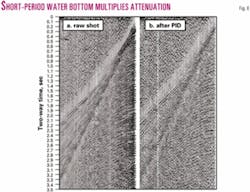
On an example of multiple reflection attenuation using the PID algorithm (Fig. 6), clearly the very strong short-period multiples contaminating the near-offset region are eliminated.
To summarize, the smoothness separation criterion is very effective for extraction of the mixed phase-lag forward wavelet from the recorded signal. The separation criterion is based on the seismic energy attenuation properties of the earth and the physics of the wave propagation phenomenon.
No assumptions about the phase of the wavelet and the randomness of the reflection coefficients are made. Moreover, no a priori knowledge about the properties of the reflective boundaries is used in the PID method. Another advantage of the PID approach is that the wavelet is not assumed to be stationary and, hence, the extracted wavelet includes all variations caused by the lithological properties of rock along the source-to-receiver propagation-path of the sound wave.
The wavelet is extracted.
What's next?
At this point we know how to use the energy attenuation properties of earth in order to extract the wavelet from seismic data. We also know that all lithological properties of the earth are encoded into the extracted wavelet. In particular, the smoothness of the amplitude spectrum of the wavelet is proportional to the energy absorption coefficient.
So, the smoothness of the spectrum seems to be a natural measure of absorption. Unfortunately, smoothness does not tell us the cause (oil, gas, etc.) of the anomalous energy absorption and, hence, is not very valuable for the purpose of direct hydrocarbon detection.
What we need is a method capable of not only detecting the anomalous energy attenuation from seismic data but also one that is able to associate this attenuation with the presence of gas and liquid in the partially saturated rock. To achieve this goal it is vital to understand and to classify the primary physical mechanisms causing the energy attenuation.
For an excellent overview of possible attenuation mechanisms and the current state of experimental measurements of absorption, see Pride et al.3 Following Pride, we assume that the seismic energy is primarily attenuated due to the following mechanisms: wave scattering from the small-scale heterogeneities, frictional flow of the liquid inside rock pores and fractures (squirt flow), and pressure changes in the gas-filled pores.
Based on this assumption we propose an attenuation model for both gas and liquid fractions in a partially saturated rock. For reasons that will become clear below, we call this model "2Q attenuation."
Most of the current work in attenuation (see, for example, Matheney, et al.,4 Roth, et al.,5 Wiens, et al.,6 David, et al.,7 and Gurevich, et al.8) is focused on forward modeling. Namely, given the lithological properties of rock (fractures, porosity, permeability, liquid saturation, etc.) predict the seismic response and, in particular, the energy absorption response.
The purpose of the 2Q attenuation model is different. It is a qualitative model that helps to interpret the energy attenuation factors extracted from the forward seismic wavelet.
2Q attenuation model
The analysis of available experimental data leads to a conclusion that, within the seismic frequency range and in the partially saturated rock, energy attenuation is proportional to the liquid-saturation and is increasing with decreasing frequency. However, in gas-saturated rock, the energy attenuation is directly proportional to gas-saturation and is increasing with frequency.
In order to be consistent with the experimental observations, we propose a linear model with two independent mechanisms (thus, 2Q model) of frequency-dependent attenuation in partially saturated rock.
The first mechanism of conversion of mechanical energy of a sound wave to heat is attributed to pore volume variation as a function of the sound wave pressure change with time. Pore volume decreases when pressure increases and vice versa, the decreasing pressure results in a local increase of the pore volume. Knowing that the energy conversion (work) in an ideal gas takes place only if gas-volume is changed, this mechanism can be associated with the gas present in the pore space. Let us call this mechanism a "compressional" energy conversion.
The sound wave pressure variation over one-wavelength distance causes volumetric force capable of moving the fluid (oil, water, gas) within the pore space. Due to the friction between the moving fluid and the pore walls, part of the sound energy is transferred to heat. For this reason, we call this mechanism of energy attenuation a "frictional" energy conversion.
Assuming that the liquid (oil and water) is incompressible, the only reason for the energy conversion to heat to take place is the frictional force. Therefore, the frictional energy conversion can be associated with the liquid moving within the pore space.
So, we distinguish two mechanisms of energy attenuation; compressional and frictional. The compressional energy attenuation is associated with the change of gas-volume within the pore space and is due to the sound wave pressure variation in time. The frictional energy attenuation is associated with liquid moving within the pore space and is caused by the sound wave pressure variation in space.
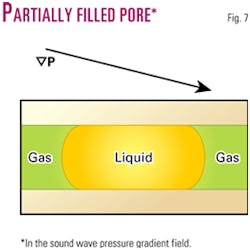
For the purpose of better illustrating the concept of compressional and frictional energy attenuation mechanisms, let us consider a simplified model of rock structure as a single pore partially filled with liquid and partially with gas, in the field of a sound wave pressure gradient (Fig. 7).
The sound wave pressure is described by the plane monochromatic wave:
null
null
Within the framework of 2Q model, the compressional (gas) and the frictional (liquid) attenuation mechanisms are considered independent from each other.
Thus, the total energy attenuation is the sum of energy attenuation caused by gas, and the energy attenuation caused by liquid present within the pore space.
To gain a better understanding of these mechanisms and to determine the frequency-dependence of attenuation within each gas- and liquid-fraction, we will examine them independently.
Next: Energy attenuation in gas and liquid filled pores, WEA analysis, and processing considerations.
The authors
Dr. Eugene Lichman (elichman @apexmetalink.com) was a founder of Discovery Bay Co., a geoscience software company now merged with two other companies to form Rock Solid Images, Houston. He previously was senior research geophysicist with Schlumberger Geoquest and is an author of numerous research papers and two US patents, one pending. His current interests include deterministic lithology detection from seismic data, multidimensional deconvolution, and velocity-independent time and depth migration. He holds a PhD in theoretical physics from the University of Kalinin (USSR).
Scott W. Peters is president of Apex Metalink Inc. Previously he was Asia manager for Jason Geosystems and a geophysicist and wire line engineer for Schlumberger. He holds a geophysics professional degree from Colorado School of Mines and a BS in geophysics from the University of Houston.
Don Squyres is senior geologist with Apex Metalink Inc. in Houston. He has been a professional geologist more than 20 years, starting as an exploration geologist with Exxon Co., USA off Texas, in Northeast Texas carbonates, and the King Ranch Frio-Miocene trend. He also has extensive experience with Class I injection wells and with environmental assessment and remediation. He has a BS in business management from Virginia Polytechnic Institute and a BS in geology from the University of Houston.


