US MIDSTREAM UPDATE: New series to cover US midstream developments
Dan Lippe
Petral Consulting Co.
Houston
This article is the first in a series that will broadly focus on the US midstream industry, and it supplants the series that since 2005 has focused on supply-demand and pricing trends in US propane markets.
Future articles will focus on short-term trends in natural gas processing plant NGL production, NGL demand in major markets, and expansion of midstream industry infrastructure including raw mix pipelines, fractionators, and export terminals.
Unless otherwise noted, the US Energy Information Administration (EIA) statistics are the primary source of historical data presented in this article and series.
Background
Before 2002, US natural gas production came from three sources:
1. Reservoirs that contained natural gas but not crude oil.
2. Reservoirs that contained primarily crude oil or condensate and natural gas.
3. Coal seams.
During 1990-2002, US gas plants processed 75-85% of US natural gas production (wet production before processing shrinkage) and 85-92% of wet marketed production, when coalbed methane production is excluded from wet-gas production. During these years, statistics from EIA show gas plant throughput volumes were 40-45 bcfd, while NGL raw mix production was 1.7-1.9 million b/d.
Over the same period, US exploration companies drilled 156,847 gas wells, according to EIA statistics. Drilling technology in the 1990s was essentially the same as in the 1950s, 1960s, 1970s, and 1980s.
The only new developments in exploration technology during the 1970s and 1980s were improvements in data processing hardware and software for analysis of seismic data. These improvements continued in the 1990s.
Beginning in the early to mid-1990s, Mitchell Energy Co., Houston, a natural gas exploration and gas processing company with extensive lease acreage in north central Texas, developed and improved horizontal drilling and hydraulic fracturing as tandem exploration technologies. This new drilling technology improved well flow rates and enabled natural gas in shale formations to be economically extracted.
By 2002, natural gas production from Barnett shale was 400-500 MMcfd, according to the Texas Railroad Commission. In 2002, recognizing the potential of new shale drilling technology, Devon Energy won a bidding war to acquire Mitchell Energy to capitalize on horizontal drilling and hydraulic fracturing technologies and the vast potential of shale plays in North America.
Devon Energy's acquisition of Mitchell Energy was the catalyst that accelerated the application of horizontal drilling and hydraulic fracturing and dramatically improved the economics of natural gas and crude oil reserves in shale formations throughout North America.
During 2002-10, exploration companies used horizontal drilling and hydraulic fracturing primarily in natural gas-prone shale plays. During this period, EIA statistics show the gas exploration industry drilled 206,085 new gas wells. During 1990-2002, 150,000 new gas wells were sufficient to hold production constant. During 2002-10, 200,000 new gas wells increased US nonassociated gas production by almost 14 bcfd.
At some point, exploration companies expanded horizontal drilling into crude oil-prone shale plays primarily in North Dakota and Texas. When oil producers applied horizontal drilling and hydraulic fracturing to these shale plays and established production basins, production of US crude oil began to revive, reversing more than 40 years of declining production.
The revival also reversed more than 20 years of declining associated gas production. Since the NGL content of associated gas (measured as gallons/Mcf; GPM) is also generally 1.5-3.0 times more than the NGL content of nonassociated gas, US NGL production began to increase rapidly.
NGL raw mix production
EIA statistics show that for 16 years (1992-2008), NGL raw mix production from US gas processing plants averaged 1.78 million b/d. During this period, production varied 1.6-1.9 million b/d (±10% of the average for this period).
NGL production from gas processing plants is a function of four variables:
1. Gross withdrawals of natural gas.
2. Gas plant throughput.
3. NGL content of gas plant throughput.
4. Gas plant NGL-recovery technology.
EIA's natural gas data collection system provides the basis for analysis of annual trends in natural gas production, gas plant throughput, and NGL raw mix production for all states and monthly trends in natural gas production and gas plant NGL production for key states (Louisiana, Oklahoma, New Mexico, and Texas).
In addition, until 2014, EIA's annual natural gas production statistics also provided breakout data for nonassociated and associated natural gas production as well as for natural gas production from coal seams (coalbed methane).
Production, plant trends
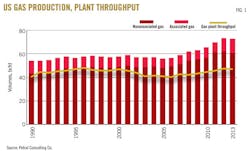
US natural gas production varied within a range of 54-59 bcfd during 1990-2006; associated natural gas production declined by about 3.5 bcfd, but nonassociated natural gas production increased by about 5.5 bcfd.
As gas exploration companies more extensively applied horizontal drilling and hydraulic fracturing in the various shale plays in Texas, Louisiana, Oklahoma, and Arkansas, total gross natural gas production in the US increased by about 16 bcfd during 2007-12.
Associated gas production (gross) increased by about 3.5 bcfd and nonassociated gas production increased by about 13 bcfd. Nonassociated natural gas production increased by 1-2 bcfd/year during 2004-10, but production increased by 4 bcfd in 2011.
Most of the increase in gross production of associated gas occurred after 2011. Furthermore, associated gas production in Texas (West Texas and South Texas) increased by 2.9 bcfd during 2007-12 and accounted for 59% of the overall increase (Fig. 1).
Gas plant throughput is a function of the volume and NGL content of marketed gas production. Marketed production is determined by gross withdrawals less volumes that are vented, reinjected, or flared.
EIA statistics for marketed gas production also include coalbed methane and shale formations. Coalbed methane production increased to 4.3 bcfd in 2001 from 0.5 bcfd in 1990. Since coalbed methane has no NGL content, its production is never processed. Additionally, during 2002-07, the NGL content of gas production from shale formations was usually below the level that required processing to meet gas pipeline quality specifications.
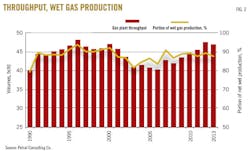
Gas plant throughput was 43-48 bcfd during 1991-2002 but declined to 41-43 bcfd during 2003-08. Throughput rates increased to 46-48 bcfd in 2013 from 42 bcfd in 2008. After adjusting for coalbed methane and shale production, gas plant throughput averaged 85-92% of marketed production during 1990-2012 (Fig. 2).
During 2003-08, nonassociated natural gas production from major shale plays in the Gulf Coast and conventional basins in the Rocky Mountains accounted for 83% of the increase in nonassociated natural gas production in the US. Despite the substantial increase in nonassociated production in the Gulf Coast, the Rocky Mountains alone recorded a large increase in gas plant throughput during 2003-08 and 2009-12.
Natural gas from conventional reservoirs accounted for the growth in production in the Rocky Mountains, and the NGL content was sufficient to warrant processing. The NGL content of gas production from shale plays in the Gulf Coast, however, was generally below the level that requires gas processing to meet gas pipeline quality specifications.
Oil, associated gas production
For the 16-year period 1992-2008, NGL raw mix production was essentially constant, varying within a narrow range of 1.6-1.9 million b/d. US NGL raw mix production began to increase in 2009 and supply growth accelerated in 2011.
Crude oil exploration companies began to apply horizontal drilling and hydraulic fracturing, at first in South Texas in the Eagle Ford shale play in 2007 and then in the mature production basins in West Texas in 2008-09.
With the accelerating application of horizontal drilling to crude oil-prone shale plays and mature reservoirs, crude production became the primary factor in the growth in NGL rich-gas production and gas plant NGL production. Furthermore, whereas growth in nonassociated gas production has become more geographically diverse, growth in crude oil production and gas plant NGL production has been concentrated in a few states.
In this article series, Texas Railroad Commission statistics will be the source for associated gas production data for Texas. EIA has recently implemented major changes to its data collection system for natural gas production; its statistics now include NGL-rich gas produced in conjunction with crude oil from shale plays with all natural gas from all shale plays.
This change has already resulted in understatement of NGL-rich gas production in Texas and other key crude oil producing states including Colorado, North Dakota, Oklahoma, and New Mexico. As North Dakota along with other key states continues to build out its gas pipeline infrastructure and gas processing capacity and as throughput rates increase, this article series will also utilize state association data to obtain a more accurate estimate of associated gas production.
Texas has been the leading source of growth in domestic crude oil production since 2008. EIA statistics show crude oil production in Texas increased by 1.8 million b/d during 2007-13. According to statistics from the Texas Railroad Commission, associated gas production in Texas increased by almost 3 bcfd during 2007-13. Associated gas production increased by 250-275 MMcfd in Oklahoma, 175-225 MMcfd in New Mexico, 250-275 MMcfd in Colorado and Wyoming, and 725-775 MMcfd in North Dakota.
NGL raw mix production
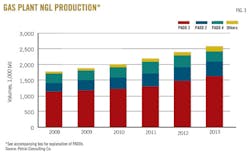
US NGL raw mix production reached 1.78 million b/d in 2008. Gas plant production increased by 774,600 b/d (43.5%) during 2009-13. Gas plant NGL production averaged 2.56 million b/d in 2013.
Gas plant NGL production along the Gulf Coast reached 1.12 million b/d in 2008 and increased by 504,500 b/d (45%) during 2009-13. The growth in NGL production in the Gulf Coast accounted for 65.1% of US gas plant NGL supply growth. Within the region, NGL raw mix production in Texas increased by 536,900 b/d, but production in Louisiana declined by 16,300 b/d and production in New Mexico declined by 16,000 b/d.
In Texas, growth in rich-gas production—associated gas production in West Texas and South Texas—was the primary factor in the growth in NGL production (Table 1).
NGL raw mix production also increased in two other regions.
In the Midcontinent, production was 311,700 b/d in 2008 and increased by 152,000 b/d (48.8%) during 2009-13. The Midcontinent has two NGL production zones. Kansas and Oklahoma are the dominant sources of gas plant NGL production in the southern zone. NGL production in the southern zone was 230,300 b/d in 2008 and increased by 96,400 b/d (41.9%) during 2009-13.
Indiana, Illinois, and Kentucky are the established producing states in the northern zone. North Dakota is the emerging source of NGL production in the northern zone, where NGL production was 81,300 b/d in 2008 and increased by 55,700 b/d (68.5%).
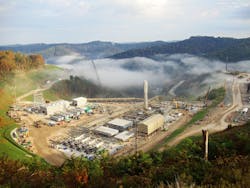
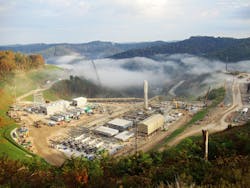
On the East Coast, gas plant NGL production was 18,700 b/d in 2008 and increased by 63,800 b/d. This was the only geographic region in which associated gas production was not the primary force in NGL production growth. Instead, Marcellus gas production in the southwest corner of Pennsylvania is one of the exceptions to the general rule that gas prone shale plays have low NGL content (Fig. 3).
C2 rejection; raw mix production
For most gas processing plants, ethane is the largest volume component. From the perspective of residue-gas quality, ethane recovery is also discretionary for many gas plants.
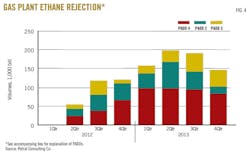
Gas plants will operate to maximize ethane recovery as long as incremental margins are positive (or at least not too negative). Profit margins supported maximum ethane recovery during 2009-11, but spot prices for purity ethane in Mont Belvieu fell to less than maximum recovery levels beginning in second-quarter 2012.
Ethane rejection reduced NGL raw mix production by 50,000-60,000 b/d in second-quarter 2012 and 110,000-130,000 b/d in third and fourth quarters 2012.
Profit margins deteriorated further in 2013 and ethane rejection reached a peak of 185,000-215,000 b/d in second and third quarters 2013. Margins began to improve for some plants in some regions, and ethane rejection declined to 130,000-150,000 b/d in fourth-quarter 2013 and 100,000-130,000 b/d in first-quarter 2014 (Fig. 4).
NGL markets
Three markets account for more than 90% of US NGL demand:
1. Petrochemical feedstock markets.
2. Gasoline blending markets.
3. Retail space heating and internal combustion markets.
Petrochemical and gasoline blending markets consume all five NGL components; retail space heating and internal combustion markets consume only propane. Before 2008, demand in domestic NGL markets, however, was sufficient to consume nearly 100% of US supply. During 2012-13, demand in domestic markets consumed only 81-87% of US supply.
Of the three primary end-use markets, NGL demand increased significantly only in the petrochemical feedstock market.
Feedstock demand
The petrochemical industry is the largest of the three major NGL end-use markets. Within this industry, the ethylene feedstock market is the largest of the petrochemical industry's NGL consumers.
Petral Consulting estimates NGL demand in the petrochemical industry by direct contact with ethylene producers and based on production capacity for other industry segments. These other segments include propane dehydrogenation (propane), methyl tertiary butyl ether (normal butane and isobutane), and propylene oxide (isobutane).
In 2008, NGL demand in all petrochemical markets was 1.15 million b/d. During 2009-13, demand increased by 426,400 b/d (37.1%) and was 1.58 million b/d in 2013.
NGL demand in the ethylene feedstock market was 1.13 million b/d in 2008. NGL demand in the ethylene feedstock market increased by 388,500 b/d (34.5%) during 2009-13 and was 1.52 million b/d in 2013. The increase in NGL demand in the ethylene market accounted for 91% of the overall increase in the petrochemical industry's NGL feedstock demand.
Ethane demand in the ethylene feedstock market was 741,100 b/d in 2008. In 2013, ethane demand was 1.055 million b/d and was 314,000 b/d more than in 2008. The increase in ethane demand was 81% of the increase in NGL demand in the ethylene feedstock market and 74% of the increase in NGL demand in the petrochemical industry.
Ethylene producers increased consumption of ethane during 2008-13 because production costs based on ethane were consistently less than production costs for all other feeds. Ethylene producers will continue to increase ethane consumption as long as its production costs are favorable compared with other feeds and availability increases to meet the feedstock requirements of new ethane-based plants.
Historically, ethylene feedstock demand for propane varied as needed to maintain supply-demand balance. In 2013, demand in the ethylene feedstock market varied by 131,000 b/d. Petral Consulting estimates demand for propane was 450,000 in January 2013 and 318,000 b/d in December 2013. Propane's share of fresh feed was about 27% in January and fell to 19% in December (Table 2).
Gasoline blending demand
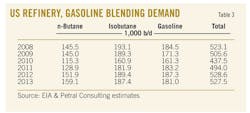
Refineries buy normal butane, isobutane, and natural gasoline for use as gasoline blendstocks. EIA statistics show refinery demand for butanes and natural gasoline was generally steady within a range of 500,000-530,000 b/d during 2008-13.
In 2010, however, demand was 437,500 b/d, due primarily to the decline in demand for normal butane. Refinery demand for butane and natural gasoline was generally flat during 2008-13 because motor gasoline production was also relatively flat (Table 3).
Retail markets
Retail markets consume propane in four primary end-use segments:
1. Residential, commercial, and resellers (space-heating markets).
2. Agriculture.
3. Motor fuel.
4. Miscellaneous industrial.
Of these four segments, consumption in the residential-commercial sector typically accounts for 75-80% of total demand in the retail market. Based on an annual survey by the American Petroleum Institute, retail demand in all segments was generally 600,000-650,000 b/d during 2008-13 but dropped to 550,000-600,000 b/d in 2011 and 2012, due to the unusually mild weather in winter 2011.
Petral Consulting estimates retail propane demand rebounded in 2013, due to colder winter weather, to 575,000-600,000 b/d.
NGL exports
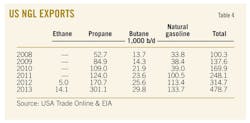
As growth in US gas plant NGL production outpaced growth in domestic NGL demand, exports increased. Exports, primarily propane, increased to offset growth in supply during a period when demand was essentially flat. NGL exports were 100,300 b/d in 2008 and increased by almost 380,000 b/d during 2009-13. In 2013, NGL exports averaged 478,700 b/d and were 577,600 b/d in fourth-quarter 2013.
Historically, the ethylene industry's feedstock flexibility was the only practical balancing mechanism for US NGL markets, but exports are now an equally important balancing element of the supply-demand balance.
In 2008, US propane exports moved primarily to Mexico, Central America, and South America. Exports to Mexico were 39,200 b/d in 2008. The combined volumes of exports to Mexico, Central America, and South America reached 47,900 b/d in 2008 and accounted for 91.5% of total US propane exports.
US propane exports increased to 302,000 b/d in 2013 and exports to Mexico, Central America, and South America increased to 197,800 b/d. Exports to Western Hemisphere destinations accounted for 65.5% of total exports.
Propane exports were 212,900 b/d in first-quarter 2013 and increased by almost 200,000 b/d during second through fourth quarter. Exports to destinations outside the Western Hemisphere were 168,200 b/d in fourth-quarter 2013 and were 90,000 b/d more than in first-quarter 2013. Exports to markets in the Western Hemisphere accounted for 60-75% of total exports in first, second, and third quarters but were only 59% in fourth quarter (Table 4).
For the first time in the history of the midstream industry, US markets also exported ethane in 2012 and 2013. US ethane exports moving by pipeline to Sarnia began in third-quarter 2012. In 2012-13, Canada's international trade agency did not capture statistics on ethane imports, but EIA is working to correct this reporting problem.
In the meantime, based on discussions with industry contacts, Petral Consulting estimates US ethane exports to Sarnia were about 12,000 b/d in 2013.
Ethane exports to Canada will increase sharply in 2014-15 when two new export pipeline projects come on stream. First, in first-quarter 2014, Mariner West began to transport ethane from gas plants and fractionators in the Marcellus basin to ethylene plants in Sarnia (OGJ, Feb. 3, 2014, p. 88). Petral Consulting estimates US ethane exports to Sarnia increased to 25,000 b/d in first-quarter 2014; EIA statistics showed ethane exports were 24,100 b/d in February.
Second, the Vantage Pipeline will transport ethane from gas plants and fractionators in the Bakken basin in North Dakota to ethylene plants in Alberta. Ethane exports via Vantage Pipeline are scheduled to begin in third or fourth quarter 2014 (OGJ Online, Sept. 4, 2013).
Outlook
For the near term, crude oil production will be the most important source of NGL-rich gas (associated gas). Gas production from most shale plays will make little or no contribution to growth in gas plant NGL production.
Marcellus shale in southwestern Pennsylvania and West Virginia and Utica shale have NGL-rich gas zones. These are the exceptions to the limited importance of gas-prone shale plays as NGL supply sources and NGL production in these two shale plays will continue to increase.
The author
Daniel L. Lippe ([email protected]) is president of Petral Consulting Co., which he founded in 1988. He has expertise in economic analysis of a broad spectrum of petroleum products including crude oil and refined products, natural gas, natural gas liquids, other ethylene feedstocks, and primary petrochemicals.
Lippe began his professional career in 1974 with Diamond Shamrock Chemical Co., moved into professional consulting in 1979, and has served petroleum, midstream, and petrochemical industry clients since. He holds a BS (1974) in chemical engineering from Texas A&M University and an MBA (1981) from Houston Baptist University. He is an active member of the Gas Processors Suppliers Association and serves on GPA's NGL Market Information Committee.
