Modeling pipeline spill determines impact on HCAs
Both small and large US operators are devoting time and resources to validate the integrity of their pipelines and assess any potential impact on US Department of Transportation-defined high consequence areas (HCAs; see accompanying sidebar). Speeding up this process are new pipeline safety rules from the US Office of Pipeline Safety (OPS).
Now, all pipeline operators that transport hazardous liquid products over long distances must implement an integrity-management program including periodic inspection, testing, and integration of information related to pipeline integrity. As a result, determining potential impact on HCAs has become a priority for many operators.
The goal is to test points along the pipeline, determine any sections that could adversely affect an HCA, then create a structured, defined way to maintain the pipeline.
The first step involves performing baseline assessments for each stretch of pipeline. Then, these assessments must be analyzed against a series of data sets as set forth by OPS to determine how each stretch of pipeline would affect an HCA in the event of a release. These data sets include high-population areas, other populated areas, commercially navigable waterways, and both drinking water and ecological unusually sensitive areas.
As with any complicated analysis, operators need a thorough yet straightforward process for testing and validating the integrity of their pipelines. This article will discuss a comprehensive process for amassing the necessary data and inputs through use of a geographic information system (GIS) model for terrestrial spill analysis; how to perform an internal validation of the results; and the role that technology can play to increase the effectiveness and speed of HCA analysis.
Identifying segments
There are three approaches for identifying segments of pipelines that, if any volume were released, could affect an HCA. These approaches are a direct-impact analysis, indirect-impact analysis, and potential-impact analysis.
Direct-impact analysis, the simplest of the three, is designed to indicate pipeline segments that go directly through HCAs and therefore have an obvious and definite impact. Performing a direct-impact analysis requires that the pipeline GIS layer be intersected with HCAs (the commercially navigable waterway lines are buffered to create areas).
Then, pipeline stationing (the linear distance along the pipeline) is collected for the entry and exit points as the pipeline passes through the various HCAs indicating precisely which parts fall within HCAs and therefore have a direct impact.
For further accuracy, an indirect-impact analysis creates a "conservative shield" around the HCAs to account for the possibility that an HCA may extend farther than the mapping resolution portrays or that the HCA has changed somehow since it was mapped.
In this scenario, pipeline sections are created which not only fall within HCAs but also are within a certain distance of them.
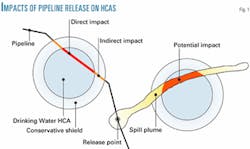
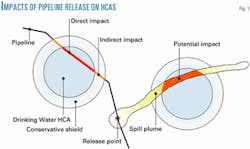
Once again, pipeline stationing is collected for the entry and exit points as the pipeline passes near the HCA, indicating precisely which parts of the pipeline fall within the "conservative shield" around the HCAs and therefore could have an indirect impact on an HCA (Fig. 1).
Direct and indirect analyses will be integral to any pipeline assessment, but these approaches don't account for potential releases that could be transported far from the pipeline, beyond the indirect buffer distance.
That's why the third approach, a potential-impact analysis, is by far the most complex of the three processes. And, it is arguably the most important in that it can determine potential HCA impact with a level of precision that goes well beyond the limits of a basic proximity analysis.
In essence, it complements the initial direct and indirect analysis results.
Two main areas that a potential-impact analysis covers are:
- Topography: Land features that cause a potential release volume to be channeled into an HCA from the pipeline.
- Hydrology: Any water features (streams, canals, lakes, etc.) that may also carry a potential release into an HCA.
By working through all three types of analysis, an operator can create a comprehensive, fail-safe integrity management program (IMP).
Necessary inputs
Before any modeling or analysis of HCA impact is attempted, the first step is to gather current and suitable data. Following is a list of the most important data sets.
- High consequence areas. A standard set of HCA data is available from the DOT's National Pipeline Mapping System (NPMS), in addition to data collected by each individual operator.
As mentioned, HCAs are available in five categories: high-population areas, other populated areas, commercially navigable waterways, and two classes of unusually sensitive areas (USAs)—ecological and drinking water.
Standardized data are supplemented with data sets from a variety of county, state, and federal sources. The operator's field experience and knowledge of the pipeline's environment are also incorporated to enhance standard data sets by adding to and modifying pre-defined HCAs.
- Elevation data. Modeling spill plume spread over terrain requires knowledge of the topography across the area covered by a pipeline system. A wide variety of sources of elevation data can provide input for a terrestrial spill model.
Contour lines can be collected from a variety of map sources, several of which are available digitally such as the US Geological Survey (USGS) digital line graph (DLG) data.
Once collected, contours can be interpolated into a surface by use of standard algorithms and into various formats, such as such regularly spaced grids of points or triangulated irregular networks (TINs), whereby the terrain is modeled using interconnected triangles for slopes.
Various surface datasets are also available, including the nationwide Digital Elevation Model (DEM) from the USGS. These surface data sets record elevations over a regularly spaced grid. In the case of the DEM, the spacing is 30 m. Tiles of data are available from the USGS on which processing can occur.
In addition, stereo aerial photography is available or may be specifically collected, from which relative elevations can be calculated. These can then be referenced to height above sea level using control points within a base data set.
Increasingly, stereo satellite imagery is available that supports the collection of elevation data through software processing using a method similar to aerial photography.
- Hydrological data. Proper modeling of the transport of a liquid release into HCAs requires consideration of hydrological transport. A wide variety of federal, state, and local hydrological datasets can be input to the modeling process.
The USGS topographic map series shows stream paths over terrain. These can be collected by digitization for the purposes of modeling. Additionally, these maps are available as scanned digital products from which hydrological features can be extracted with image-processing techniques.
Many states make digital hydrological data sets available. For example, Louisiana provides several detailed hydrological network layers describing stream location and characteristics (www.gis.ldeq.org; 2002). Similar data sets are available for other states.
The US Environmental Protection Agency (EPA) releases a nationwide stream network data set that describes the location of rivers and lakes. This set is available digitally as a line (vector) layer. Additional nationwide data sets are available from federal and state sources that also present the hydrological network as a vector layer at different scales and levels of complexity.
Given elevation data, it is also possible to extract a hydrological network using GIS processing. Channels can be identified from terrain characteristics, and then streams derived as linear features based on flow accumulation.
- Drain volume. A potential release volume is required for each release point. This indicates the volume of product that could be released at a specific point along the pipeline in the event of a rupture.
Drain volume is an important contributor to release volume. Other contributors include surge pressure and the amount of liquid released during the time it takes to close valves.
For accurate modeling, operators should also collect volume data based on a single pipeline, specific value, or analysis that has been performed independently.
The influence of terrain profiles, placement of valves, pressure, and closure times, however, should also be considered.
- Pool thickness. Pool thickness takes into account a number of factors that affect the ability of the land surface to absorb a released product. Land cover characteristics such as surface type and soil wetness are considered in addition to properties of a released product, such as viscosity and volatility, which influence the rate a release is absorbed into the environment, whether into the ground by absorption or air by evaporation.
Absorptivity and evaporation are modeled by changing pool thickness as a plume moves across land. The rate at which absorption occurs can be established for each cell in the terrestrial model or can be set over the system. If local variations in absorptivity are modeled, soil, climate, and land cover data sets are used to vary the absorptivity spatially.
Absorptivity and evaporation can also be modeled based on particular product characteristics along the length of a pipeline.
- Pipeline location. Inherent in the spatial modeling process are accurate digital data describing the location of the pipeline.
Ideally such a digital centerline is "intelligent," possessing not only location information but recording pipeline stationing. Results can then be provided in terms of stationed lengths of pipeline, as well as spatial locations.
Spill modeling
Once data sets are gathered, operators can model a potential release to determine where released liquid would travel. As mentioned, looking at the land and hydrology transport components is critical to performing a complete assessment of potential impact.
Also called "terrestrial spill modeling," this more comprehensive approach includes analyzing the terrain surrounding a pipeline and assessing where a given release would travel when it comes into contact with a hydrology network within a set amount of time (Fig. 1).
To model the impact over land, an operator would use internal documentation, as well as digital elevation data. For the land-transport component, the exact shape of a release plume is determined by considering flow between points in the elevation data.
After the initial release, volume is distributed to adjacent cells, modeling "wave fronts" that move across the terrain. The distribution of the volume is based on the elevation of the surrounding cells.
Which cells will receive volume and how will the volume be allocated across the adjoining cells? This is all part of the analysis to determine flow.
Subsequent wave fronts must also be analyzed until either the volume is depleted or a release plume comes in contact with a cell that has been flagged as having a hydrological component.
At this point, the analysis would shift. The remaining volume of liquid would now be analyzed for its impact on the hydrology network.
When a release plume reaches a hydrologic feature, modeling would focus on flow direction, stream order, and velocity to determine the direction and distance the released liquid will be transported.
Because flowing water in a stream can carry a release a considerable distance, the stream velocity is combined with an estimated operator response time to determine how far a release might be transported.
To model the impact on waterways, operators can also make use of national or regional hydrological data. As mentioned previously, requirements include information about surface-water features such as lakes, ponds, streams, rivers, springs, and wells. Ideally surface-water features are combined into a system that links streams and features to form a surface-water drainage network.
An overlay comparison of the stream network can be made to the elevation data (used for land transport) to derive a gradient for each stream network segment. By combining gradient data with velocity data, operators can estimate velocity for all stream networks.
Modeling spill points
After working with more than 10 operators and analyzing more than 45,000 miles of pipeline, we have learned that direct and indirect-impact analyses only tell a part of the story. Until a potential spill is modeled to determine flow and impact on land and hydrology features, HCAs may be inadvertently overlooked.
A test of the terrestrial spill model is described presently, which incorporates publicly available data. Model development and calibration were also achieved through extensive consultation with pipeline operators.
These operators provided input on assumptions that could be made in the model and guidance on how variables should be initially set.
Variables include the location of chosen release points, pool thickness, and release volume.
Evaluation of the terrestrial spill model involved a series of tests performed on various surfaces and with differing hydrological networks. These are categorized as:
- Sample surfaces generated artificially.
- Real surface data representing terrain.
- Real spills where plume mapping had occurred.
The artificial test surfaces provided simple representative topographic features on which simulated volumes of liquid were released.
The results were interpreted to determine whether they represented realistic plumes.
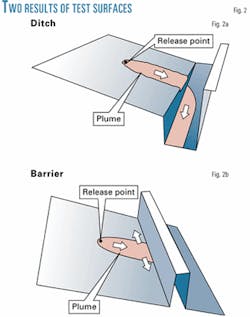
Sixteen surfaces were generated, ranging from a flat plane (generates a circular plume from the release point) to simple inclined planes (a plume flowing downwards in a parabolic shape with limited lateral spread) to complex features (including ditch and barrier scenarios).
Fig. 2 shows the results of two of the test surfaces. Results from these analyses were consistent with expectations.
Many additional tests simulated release plumes over real land surfaces. Performing such tests on actual terrain surfaces clarifies plume behavior in specific circumstances (as seen in Fig. 3) and validates the model behavior. These tests included both terrain and hydrological considerations.
Fig. 3 illustrates a single point release against USGS 1:24,000 base map data.
Fig. 3a indicates the location of the release on a ridge. Flow proceeds down the north and south slopes of the hill range.
To the north, Bear Lake is impacted. This lake does not feed a stream, and the release is therefore trapped. To the south the release impacts a stream, the Kroft Ditch. Released liquid moves downstream to Bull Lake, exits the lake, and continues through the hydrological network.
Fig. 3b shows the downstream transport of the release.
After transport for a specified time, the release is trapped by mitigation measures, such as a boom, and transport reaches its conclusion.
Fig. 3c shows the release transported into an "Other Populated Area" HCA more than 6 miles away.
A release, as modeled here, is therefore identified as having the potential to impact an HCA, which would not have been identified using a 0.5-mile buffer approach.
Finally, the terrestrial spill model must be validated against actual releases. Because operators are hesitant publicly to release data on individual spills, however, the model has been validated by sharing results with operators. They've used these results as the basis for comparison with releases that they have incurred and in turn provided feedback.
In addition, data have been obtained on actual spills, and the model has been compared to those measurements. For example, a specific release in Bemidji, Minn., in 1979 has been the subject of considerable research by the US Geological Survey Bemidji Crude-Oil Research Project (USGS 1979-2002). Maps of the original 1979 release at the site were available.
Comparing the mapped results to simulations run with the model yielded further confirmation that the model was appropriately simulating releases.
Building an IMP
The terrestrial spill model produces a number of findings that allow an operator to implement a comprehensive and accurate integrity-management program.
Using results from a terrestrial spill model, an operator can identify the start and end of each pipeline segment identified as having a direct, indirect and potential impact on HCAs.
Additionally, map output is produced from the results of a spill model that describes the location of the release plumes and indicates the hydrological transport that occurs. Examples of these are shown in Figs. 4 and 5.
null
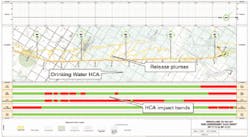
Fig. 4 shows a sample map product with the results of potential release modeling.
The release plumes emanate from the pipeline. HCAs (in this case, Drinking Water) are shaded polygons across the map.
The pipeline segments that could affect an HCA are a series of schematic bands at the bottom of the map, categorized by HCA type and aligned with the pipeline in the map frame.
The lower band, representing the Drinking Water HCA, appears as mostly black, indicating substantial impact on that HCA class as a result of this analysis.
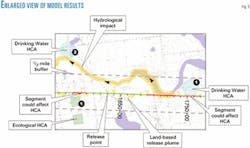
Fig. 5 shows an enlarged and annotated view of the model results. A 1/2-mile buffer has been added for the purposes of this illustration.
The various modeled release points appear as tick marks on the pipeline. Terrestrial release plumes emanate from these modeled release points. Where a release impacts a hydrological feature is illustrated by shading around that feature.
Transport into HCAs by either the overland plume or hydrological transport causes a specific release point to be identified as having the potential to impact an HCA.
A pipeline segment is then derived from these points.
The HCAs marked [1] are correctly identified as the subject of an impact by both the terrestrial spill model and 0.5-mile buffer.
The Drinking Water HCA marked [2] is impacted via hydrological transport, however, and is some distance outside the 0.5-mile buffer.
Any operator can use both internal and publicly available data to model releases along a stretch of pipeline. Using the terrestrial spill modeling process described in this article and with the necessary data inputs, an operator can predict terrestrial flow paths, hydrological transport, and the extent of potential liquid releases.
As a result, an operator will have a more accurate indication of the segments of a pipeline that could impact an HCA should a spill occur. This is the first step towards building a comprehensive integrity management program.
The authors
Don Paige is director of data services at GeoFields Inc., Atlanta. Before joining GeoFields, he worked in project management for ESRI Australia, a supplier of GIS software. He also operated a consulting company, providing spatial data management services. Paige holds a BSc (1997) in geology from the University of Natal, Durban, South Africa.
Nick Park is director of applied technology at GeoFields, joining the company in 2001. His experience includes 8 years of designing software for spatial data processing. He holds an MSc (1995) in GIS from the University of Leicester, UK, and a BSc (1994) in geography from the University of Leeds, UK.
Jonathan Posner is a project manager and consultant at GeoFields. For more than 7 years, he has worked on a range of engineering and data management projects. Posner holds a BA (1995) in anthropology from the University of Florida.
