Studies of LNG spills over water point up need for improvement
Current understanding of LNG spills over water is conservative, primarily lacking realistic testing and experimental validation in elements of the analysis that have a direct influence on the size of the fire and therefore the size of exclusion zones.
Three elements that significantly influenced the size of exclusion zones are the flow rate of LNG from a breached tank, the influence of waves on the spreading pool, and the shape and size of the resulting pool fire.
The flow rate of LNG from a breached tank has not been rigorously addressed, the empirical data on the influence of waves on the behavior of the LNG pool are limited, and no experiments have been carried out on pool fires at the scale of the contemplated accident scenarios. Current information indicates that the size of an LNG pool fire resulting from a tank breach is overestimated.
The challenge to the industry is to close these gaps in the state of understanding and to identify and recognize the most efficient analysis tools for the ultimate purpose of raising the collective confidence in the size of the necessary exclusion zones around infrastructure and people for both onshore and offshore LNG receiving terminals.
This article summarizes the steps involved in the analysis of an LNG spill scenario and identifies a short list of critical phenomena that require better understanding to ensure that the risk-assessment analyses of future LNG terminals are defensible.
Conflicting demands; spill studies
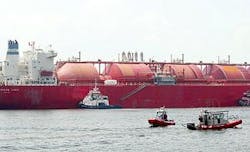
Increasing US demand for natural gas can only be practically met through a rapid increase in imported LNG, which has resulted in multiple proposals for new LNG receiving terminals on the east, west, and gulf coasts of the US.
Heightened security and safety concerns following the Sept. 11, 2001, terrorist attacks, however, have resulted in a conflict between the corporate drive to satisfy the market demand, the government’s public safety and energy security obligations, and the public’s risk alertness. Local residents continue to express concerns for their safety, while corporate leaders are eager to move forward with the process of permitting future facilities.1
While the US Federal Energy Regulatory Commission (FERC) has been responsible for the permitting process of onshore facilities and the US Coast Guard serves the corresponding role for offshore facilities, the Department of Energy (DOE) continues to sponsor engineering studies aimed at better understanding the risks and hazards associated with receiving terminals. Several studies have addressed this topic.2-6
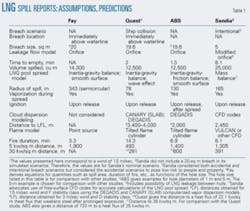
The Sandia National Laboratories’ report elevated the engineering sophistication and credibility of the scenario and risk-analysis methodology (see OGJ’s LNG Observer, April-June 205, p. 10). That said, the current state of understanding for sizing safety exclusion zones at LNG receiving terminals, remains incomplete. The exclusion zone for injury to people, as calculated by Fay, Quest Consultants Inc., ABS Consulting Inc., and Sandia varies by about a factor of 4, ranging from 493 m (Quest) to 1,900 m (Fay).
The studies consider LNG releases from LNG tankers near infrastructures and populated areas, either at or en route to a receiving terminal. The studies address both intentional and accidental release events and attempt to model the size of the resulting fire and the impact of thermal radiation on property and people to quantify safe separation distances and exclusion zones. To do this, the studies break down the problem into the following steps:
1. Estimate the size of the breach that can intentionally or accidentally form in an LNG tank.7
2. Assess the rate of release of LNG from the tank onto the water surface.
3. Assess the size of the resulting LNG pool.
4. Assess the reach of an ignitable cloud of methane vapor.
5. Assess the size of the pool fire.
6. Quantify the exclusion zones for people and infrastructure.
These studies consider the vapor cloud to be ignited at the time of release. Under this scenario, the LNG evaporates from the spreading pool due to heat from the fire above and from the water below. Although multiple ignition sources are likely as the tank is breached, it is possible for a dense methane cloud to form and be transported away from the ship.
If ignition occurs away from the LNG pool, the flames may not propagate back to the LNG pool.8 The fate of the unignited methane plume and the distance beyond which it becomes diluted below the ignitable concentration of 5% are important safety considerations in quantifying exclusion zones.
When ignition occurs early, the LNG pool initially spreads on the water surface and then reaches its largest size when the spill rate about equals the rate at which gas is burned. This is when the radiated heat is at its maximum. This maximum radiated heat from the pool fire is used to define the size of two exclusion zones.
The first zone is the danger zone to people and is based on the heat flux that can be withstood by people for a brief time (5 kw/sq m as specified by National Fire Protection Association Code 59A). The second zone is the danger zone to property and is based on radiative ignition properties of typical materials used in construction; NFPA 59A identifies this heat flux limit at 30 kw/sq m.
The accompanying table summarizes the critical information from reports by Fay, Quest Consultants, ABS Consulting, and Sandia.3-6 Some of the reports performed calculations over a range of parameters (e.g., breach size, wind conditions). The table presents results for the most similar scenarios to provide some comparison among the different approaches.
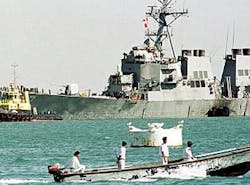
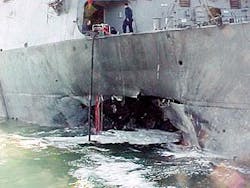
All of the reports start with an estimate of the size of the breach in the tank, which falls in the size range of 1-20 sq m. All of these reports also place the breach below the LNG level in the tank; Quest determined the worst-case scenario from an LNG leakage standpoint to be a breach just above the water level. This was also the location of the breach caused by the small craft attacks in Yemen on the USS Cole on Oct. 12, 2000, and the French oil tanker Limburg on Oct. 6, 2002.
The most recent study, performed by Sandia National Laboratories, advocates the use of computational fluid dynamic (CFD) programs to model each step of the LNG spill and ignition sequence. CFD can provide a more detailed simulation of the scenario than previous attempts and can also be more adaptable to individual sites.
Many of the results included in the Sandia report, however, were based on simpler models, similar to those used by earlier reports. Such simplified approaches are very effective with the appropriate validation and these therefore should not be discounted without objective scrutiny.
In all cases, each step of the LNG spill analysis builds upon and depends on the previous one and the outcome is only as accurate as the collection of assumptions that are made. Inaccuracies at each step accumulate and contribute in an integral manner to the end result, namely the size of exclusion zones.
This article focuses on three components of this analysis that have a significant impact on the size of proposed exclusion zones:
• The rate of LNG flow from the breached tank.
• The effect of waves on the spread of the LNG pool.
• The character of very large pool fires.
Leakage from breached tank
All the reports2-6 model the process of LNG discharge as a steady and well behaved orifice flow, driven by the hydrostatic pressure head of LNG above the hole. This type of flow, however, can reliably be said to occur only if the tank was open to the atmosphere at the top. Insulated LNG tanks are sealed, not open to the atmosphere.
In practice, the LNG will flow in a surge-like manner out of a breached tank. This flow has a different physical character from what has been assumed by all these studies: It is expected to have the same character as the familiar “glug-glug” of a bottle as it is emptied.
As a result, the orifice flow model used in the reports overestimates the spill rate of LNG and therefore the maximum size of a hypothetical pool fire. A breach in a closed-top tank of any subcooled liquid can result in a maximum spill size up to six times smaller in surface area than the pool sizes published to date.9 Any such significant reduction in flow rate would then result in smaller pool fires than previously predicted and consequently less radiative heating from the pool fire.
The flow rate of LNG from a breached tank will require experimental testing to develop quantitative models that can be used in future risk analyses.
Effect of waves
Although the Quest report4 addressed the effect of waves in a simplified manner, assuming them to be stationary, it clearly demonstrated that waves reduce the spread of the LNG pool, particularly in the late stages of the spill. As the LNG pool thins, the gravity-driven spreading of the pool will slow across the waves when the LNG becomes trapped in troughs between waves.
At this point, the LNG becomes trapped and spreads in the troughs, and the motion of the pool will be strongly influenced by wave motion, which will cause the LNG pool to break up into multiple individual puddles of LNG that will follow the waves. In the wave troughs, the interface between LNG and the water will behave in a largely frictionless manner, unlike spills of light fuels, where the fuel and water form an intimate contact at the interface.
The temperature difference between water and LNG is sufficiently large to support film boiling and to form a thin vapor layer at the interface, with only methane vapor contacting the water. This thin vapor layer drastically reduces the friction between the two liquids, much as the motion of water droplets dancing on a hot plate is nearly frictionless.
Waves therefore have the net effect of creating a pool of a lesser surface area than predicted by flat and frictionless models.
The pool will be broken up in the later stages of a spill (typically measured in minutes) and the local wave characteristics primarily influence the motion of the separated puddles. The influence of waves on the fate of a spill needs to be better quantified in the form of models that can be incorporated into the same software that captures the effect of wind and currents.
Very large pool fires
Following ignition of the LNG vapor cloud, methane boils under the influence of heating from the fire above, as well as from the water below. The rate of evaporation of LNG from the pool remains relatively poorly quantified, and the character of the ensuing pool fire has been described with empirical models based on much smaller pool fires than those predicted by the LNG spill models.
The rate of evaporation is a critical parameter in this analysis, as it affects the time for the pool to dissipate fully, the amount of gas available for combustion, and therefore the size of the fire. CFD is a valuable tool in making the connection between evaporation and fire size.
In all cases, the fires will be optically thick, and the radiation can therefore be modeled based on the shape of the flame. Unfortunately, the shape of very large pool fires is not well known. The Moorhouse correlation for flame height predicts flame height-to-diameter (L/D) ratios between 1.0 and 2.0.10 The literature indicates that larger pool fires tend to break up into flamelets or a collection of smaller pool fires, resulting in a more realistic L/D ratio of 1.0 or less.11-13
This flame breakup will be enhanced by the presence of waves and the deformation of the pool into elongated shapes. The net result is a reduced amount of thermal radiation on surrounding structures and infrastructure.
This effect is currently poorly characterized. Even CFD codes, that can capture the dominant fluid mechanics of large pool fires, require additional experimental validation. It is likely that a combined effort of experiments and CFD analysis will yield greater confidence in the expected L/D ratios for large and non-circular pool fires. Such correlations will be helpful to future safety and security impact studies.
Winds, currents
Currents, winds, and waves will influence spilled LNG. Wind will significantly influence mixing and transport of natural gas clouds and plumes and will enhance its rate of vaporization from the liquid pool.
When the water surface is turbulent due to strong wind action or breaking waves or when LNG droplets are suspended into the air by wind in the form of a spray, the interfacial area available for LNG to evaporate will be larger than with a flat surface. With an increased contact area, the rate of vaporization will increase.
Wind not only enhances evaporation, which reduces the footprint of the liquid pool, but it also distorts and elongates the pool shape into geometries that are no longer circular or semicircular. The literature for oil spills has broadly addressed this phenomenon, where wind and current-induced drag cause advection and spreading. While these two effects will also influence LNG spills, their contribution will differ from the oil spill experience partly due to the reduced friction but also because of the much shorter timescale of an LNG spill (measured in minutes instead of hours or days as is the case for oil spills).
Due to the reduced friction between the LNG pool and water, the LNG pool will be more responsive to winds than to ocean currents, unlike light fuel spills that intimately contact the water. The approach of existing algorithms that are commonly used for oil spills14 15 can be naturally extended to LNG spills. The relative contribution of various effects, however, will have to be adjusted and validated, and the influence of waves will need to be added.
The recent Sandia report’s advocacy of CFD programs to model each step of an LNG spill up to and including the ensuing fire represents a deviation from the simplified analyses used by all previous studies. CFD offers improved adaptability to different site configurations, particularly to sites with infrastructure and a shoreline that may influence the fate of a spill and the associated vapor plume.
This flexibility brings complexity to the process that is unnecessary in certain aspects of the analysis, such as the influence of waves and wind on the LNG pool. There is a place for accurate validated simplified models in situations where the underlying assumptions are reasonable. ✦
References
1. The LNG industry has an excellent safety record. An explosion in Skikda, Algeria, on Jan. 19, 2004, interrupted 2% of the world’s liquefaction capacity. Because of this explosion, questions have been raised about safety at proposed regasification facilities. Those concerns may not be relevant to the safety of receiving terminals planned in the US, both onshore and off, because of the processing equipment differences between liquefaction and regasification.
2. Lloyd’s International Registry of Shipping, “Explosion & Gas Release from LNG Membrane Carriers - Generic Consequence Assessment,” 2001.
3. Fay, J.A., “Model of spills and fires from LNG and oil tankers,” Journal of Hazardous Materials, B96 (2003), pp. 171-188.
4. Quest Consultants Inc., Norman, Okla., “Modeling LNG Spills in Boston Harbor,” 2004.
5. ABS Consulting Inc., Houston, “Consequence Assessment Methods for Incidents Involving Releases from Liquefied Natural Gas Carriers,” Report 131-04, GEMS 1288209, 2004.
6. Sandia National Laboratories, Albuquerque, NM, “Guidance on Risk Analysis and Safety Implications of a Large Liquefied Natural Gas (LNG) Spill Over Water,” 2004.
7. Intentionally or accidentally.
8. Royal Dutch/Shell Group, LNG Shipping, London: Shell Gas and Power External Affairs, 2002.
9. Clanet, C., and Searby, G., J. Fluid Mech., Vol. 510 (2004), pp. 145-168.
10. Society of Fire Protection Engineers, SFPE Handbook of Fire Protection Engineering, 2nd Edition, 1995, pp. 3-204.
11. Zukoski, E.E., “Properties of Fire Plumes,” Combustion Fundamentals of Fire, London: Academic Press, 1995, pp. 101-219.
12. Corlett, R.C., “Velocity Distribution in Fires,” Heat Transfer in Fires, Washington: Scripta Book Co., 1974, pp. 239-255.
13. Cox, G., and Chitty, R., “Some Source-Dependent Effects of Unbounded Fires,” Comb. Flame, Vol. 60 (1985), pp. 219-232.
14. ASCE Task Committee on Modeling of Oil Spills, “State-of-the-Art Review of Modeling Transport and Fate of Oil Spills,” J. Hydr. Engineering, pp. 594-609, 1996.
15. French, D., “Modeling Oil Spill Impacts,” State of the Art in Oil Modeling and Processes, Southampton, UK: Wessex Institute of Technology, 2001.
The authors
Harri Kytömaa (kytomaa @exponent.com) is principal engineer and the director of thermal science and engineering at Exponent Inc., Natick, Mass. He specializes in mechanical engineering and the analysis of fluid flow phenomena, fires, and explosions. He has performed research in cryogenic fluid mechanics, heat transfer, and phase change phenomena. Kytömaa has held several academic, research, and consulting positions, including that of associate professor of mechanical engineering (1986-94) at the Massachusetts Institute of Technology where he was head of the fluid mechanics laboratory. He has also held positions as visiting professor (1994) at the Helsinki University of Technology and at the DOE Pacific Northwest Laboratory (1993) in Washington, DC. Kytömaa holds a PhD (1986) and an MS (1981), both in mechanical engineering from the California Institute of Technology and a BSc in engineering science (honors; 1979) from Durham University, England.
Filippo Gavelli is a senior engineer in Exponent’s thermal sciences practice and has investigated single and multiphase flows with applications to nuclear-power generation facilities, refrigeration, and fire protection, detection, and suppression systems. Before joining Exponent, Gavelli was a member of the faculty of the Department of Mechanical Engineering at the Catholic University of America, Washington, DC, where he taught the thermal sciences and performed research funded by various federal agencies. He holds a PhD (1997) in mechanical engineering from the University of Maryland, College Park, and a BS (cum laude; 1993) in nuclear engineering at the University of Bologna Italy.
