ALASKA IN-STATE PIPELINE—1: Study confirms feasibility of in-state Alaskan gas pipeline
Zhenhua Rui
Independent Project Analysis Inc. USA
Ashburn, Va.
Construction of an Alaska in-state natural gas pipeline is feasible at any of three flow rate scenarios: 500 MMcfd, 750 MMcfd, and 1,000 MMcfd. Selection of a particular rate depends on specific conditions and perspectives, but the results of the study underlying this article show that building an Alaska in-state gas pipeline is reasonable for all three, assuming a 30-year operating life.
This first in a two-part series of articles examines the factors influencing construction of an Alaskan in-state gas pipeline and the form such a project might eventually take. The second part will assess capital costs before discussing the modeling of the various throughput options for an in-state system.
Background
The discussion and debate over building an Alaska in-state natural gas pipeline has intensified in Alaska as gas resources in Cook Inlet continue to deplete. The Cook Inlet basin has supplied low-cost gas for south central Alaska's residential, commercial, and industrial demands, and for exports of large quantities of fertilizer and LNG since the late 1960s.
The lack of sufficient natural gas production from Cook Inlet, however, led to the closure of the Agrium fertilizer plant near Kenai in 2007 and the formal closure of the Kenai LNG export plant in 2011, even though it has continued to lift cargoes on individual contract basis to meet post-earthquake Japanese demand.1 2
The shortage of gas in south central Alaska has become a major concern for the state, despite technologically recoverable natural gas reserves of roughly 35 tcf.3 The most viable solution for continuing to supply Alaska with low-cost gas is to bring future supplies from ANS fields to south central Alaska. The abundance of natural gas in ANS can provide sufficient gas for a pipeline to supply the needs of Alaska for the long term.
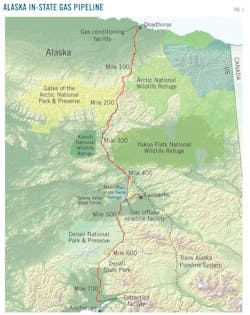
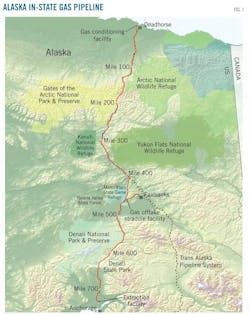
Fig. 1 shows the proposed gas pipeline. The system includes a 737-mile, 24-in. OD mainline running from Prudhoe Bay to Livengood before turning south into the Parks Highway corridor. The mainline pipeline continues south, connecting to the Beluga pipeline at its MP39 near Big Lake. A 35-mile, 10-in. OD lateral from the main pipeline a few miles north of Nenana, near Dunbar, travels to northeast of Fairbanks.4
For the purposes of this article:
• Pipeline A refers to the section between Prudhoe Bay and Dunbar station.
• Pipeline B to the section between Dunbar station and Beluga.
• Pipeline C to the section between the Dunbar station and Fairbanks.
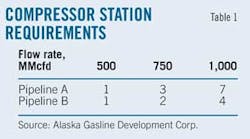
The system's maximum allowable operating pressure (MAOP) is 2,500 psi.4 Flow rates and distances will determine the number of compressor stations along the pipeline (Table 1). In addition to pipeline sections, this article examines a gas treatment plant at ANS to remove such contaminants as carbon dioxide, water vapor, and hydrogen sulfide, and an LNG plant at a tidewater site in south central Alaska to manage seasonal fluctuations in demand and export LNG to the Pacific Rim market. Six potential tidewater site options for the LNG plant are Nikiski, Port Mackenzie, Seward Marine Industrial Center, Port of Anchorage, Western Kenai Peninsula, and Homer.5
This article describes the background and market for an Alaska in-state gas pipeline and discusses parameters, assumptions, and methodologies for models of the Alaska in-state gas pipeline. Monte Carlo model simulations allow evaluation of the feasibility of an Alaska in-state gas pipeline by assigning triangular distribution of the values of economic parameters. The article analyzes and compares simulated results of models for an Alaska in-state gas pipeline at different flow rates.
Supply, demand
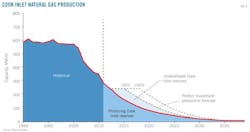
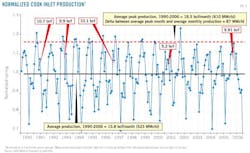
Fig. 2 shows forecast Cook Inlet natural gas production6 will continue to decline without new investment in natural gas exploration and development. Average production will be less than 100 MMcfd after 2015. Even best-assumption projections have Cook Inlet production remaining constant at 250 MMcfd through 2019. Cook Inlet basin, therefore, cannot provide sufficient long-term natural gas for south central Alaska and other Alaskan markets. Data show the need for a gas pipeline from ANS to markets in south central Alaska.
Alaskan natural gas demand varies by season. An analysis of Alaskan consumption from 1990 to 20067 provides long-term perspective on the monthly variation in gas demand by type (industrial, residential-commercial, electricity production, field operations, etc.). Peak consumption during this period is 610 MMcfd/month, 87 MMcfd greater than average monthly consumption.
For Alaska in-state gas consumption (excluding LNG plant consumption) 2002-08, July accounts for 7% of annual consumption, while January accounts for 9.6%. The data show a significant seasonal variation in Alaskan gas demand. Storage or an LNG plant, therefore, would have to be built to store or process the gas remaining after in-state needs are met.
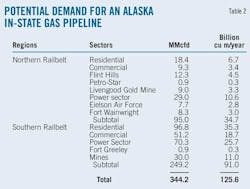
Potential natural gas demand for an Alaska in-state gas pipeline is based on "In-State Demand Study," a study conducted by Northern Economics Inc.8 (Table 2). This potential natural gas demand is used as the in-state natural gas market for an Alaska in-state gas pipeline in this article.
Gas price
This section discusses historical Alaskan gas prices, Alaskan wellhead gas prices, US Henry Hub prices, forecast US wellhead gas prices, and forecast US Henry Hub gas prices.
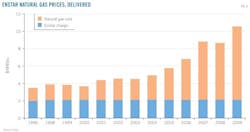
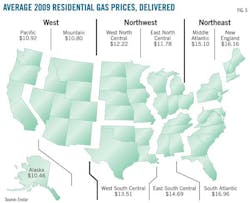
Since 1963, nearly 70% of Alaskans have depended on low-cost natural gas from Cook Inlet. Fig. 4 shows Enstar's delivered natural gas price to consumers between 1996 and 2009. The average price of Cook Inlet gas was 30% to 50% less than prices in other states between 1996 and 2009.9 Natural gas prices in south central Alaska increased sharply in 2005 and continued to rise, especially in 2007 and 2009, but remained lower than those in other states.
The New York Mercantile Exchange uses the Henry Hub price for its natural gas futures contract. The Henry Hub spot price refers to natural gas sales contracted for next day delivery and title transfer at the Henry Hub. The Henry Hub price also measures gas without gas liquids,11 (EIA, 2011) whereas US wellhead price, the price received by natural gas producers for marketed gas, includes the value of natural gas liquids and is influenced by all transactions occurring in the US.
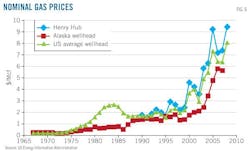
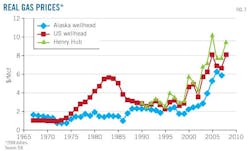
Fig. 7 shows the historical nominal prices of the Henry Hub, Alaska wellhead, and US average wellhead, while Fig. 8 shows the real price of the Henry Hub, Alaska wellhead, and US average wellhead. The three curves trend up in both. The Henry Hub price is the highest, while the Alaska wellhead price is the lowest. The changing trend of the Henry Hub price is almost the same as the US average wellhead price, though the Henry Hub price is about $0.60/Mcf higher than the US average wellhead price.
Alaska wellhead price has been an average of $1.83/Mcf lower than Henry Hub and US wellhead prices. The low Alaska wellhead price is a major factor in making inexpensive natural gas available in south central Alaska.
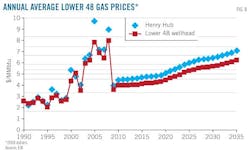
Fig. 8 shows the projected annual average Henry Hub and Lower 48 wellhead gas prices between 2010 and 2035. The Henry Hub price for the next 25 years starts at $4.43/MMbtu in 2010 with an average growth rate of about 2%/year. The Lower 48 wellhead gas price begins at $3.98/MMbtu in 2010 and also has an average growth rate of about 2%/year.
Pacific Rim
The AGDC report "Greenfield liquefied natural gas economic feasibility study," analyzed the LNG option.5 The Pacific Rim market is the most promising potential market for Alaskan natural gas because China, Japan, and South Korea lack sufficient indigenous energy supplies. They also lie a relatively short distance from Alaska.
Japan's LNG price follows the Japanese Customs Cleared (JCC) price (Equation 1 in the accompanying equations box).5 China and India, however, have started to use long-term contracts to get low LNG prices through negotiation. Equation 2 shows AGDC's forecast price for Alaskan LNG exports.5
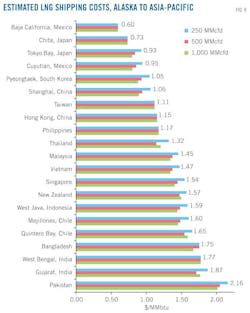
The EIA forecast average price for West Texas Intermediate oil price in 2018 is about $103/bbl (2008 dollars), climbing 1% to 3%/year. Using the forecast WTI oil price and Equation 2 yields a 2018 LNG price in Japan of $16.3/MMbtu. Fig. 9 shows estimated LNG shipping costs from Alaska to the Pacific Rim-Indian Ocean. This article places regasification costs at $0.50-1.00/MMbtu, plus a $0.25-0.50/MMbtu connection fee.
Economic parameters
Economic parameters for building Alaska in-state gas pipeline models include rate of return, unit cost of capital and operation, fuel loss, tax rate, depreciation, debt-to-equity ratio, inflation rate, capital and cost escalation rate, construction pattern, project lifetime, and location cost factors. All these parameters influence the feasibility of building an Alaska in-state gas pipeline. Calculating values for these parameters uses comprehensive analyses of historical pipeline and compressor station costs, and other historical and empirical data.
Rate of return
Rate of return, also known as return on investment (ROI), is a measure for evaluating the efficiency of an investment or comparing the efficiency of a number of different investments. Equation 3 shows the general formula for calculating ROI; the higher the ROI, the more profitable the project.
The minimum acceptable rate of return is also called the "hurdle rate." The weighted average cost of capital (WACC) is a practical way roughly to measure a firm's internal hurdle rate for financing decisions. Equation 4 shows calculation of the WACC.10 The appropriate hurdle rate for the Alaskan in-state gas pipeline project is in the range of 10-15%.11 This article assumes an overall required rate of return for an Alaska in-state gas pipeline of 10%.
Capital, operation costs
Capital costs in this model include:
• Gas treatment plant on the ANS.
• Pipeline A, Pipeline B, and Pipeline C.
• LNG plant in the Cook Inlet region.
The capital costs in this model do not include:
• Pipeline support infrastructure and joint facilities at ANS.
• Fairbanks offtake facility.
• Financing costs.
Capital cost varies, depending on location and flow rate. Pipeline costs south of Fairbanks are lower than north of Fairbanks. The cost models are based on National Economic Research Associate's model,11 using $/in./mile for pipeline cost estimation, including compressor station costs. Pipeline unit costs are derived from analyses of historical pipeline and compressor station costs by Rui, et al. (OGJ, July 4, 2011, p. 120, and OGJ, Jan. 9, 2012, p. 110).12-14
Energy Project Consultants LLC, Colorado Springs, Colo., provided cost estimates for the gas treatment plant,12 with AGDC supplying them for the LNG plant.15 Table 3 shows the assumptions guiding breakdown of capital cost.
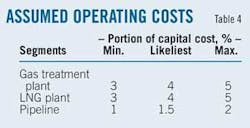
Operating costs are a percentage of capital cost. Table 4 shows the assumed operating cost of each segment.
References
1. "Agrium announces closure of Kenai nitrogen facility," Agrium, 2007, http://www.agrium.com/index.jsp.
2. "Kenai LNG plant set to close this spring," Petroleum News, Vol. 16, No. 8, August 2011.
3. Thomas, C., Doughty, T., Hackworth, J., North, W., and Robertson, E., "Economics of Alaska North Slope gas utilization options," Idaho National Engineering Laboratory, INEL No. 96/0322, 1996.
4. "Alaska stand-alone gas pipeline/ASAP," Alaska Gasline Development Corp., 2011.
5. "Greenfield liquefied natural gas (LNG) economic feasibility study," Alaska Gasline Development Corp., 2011.
6. Hartz, D., Kremer, M., Krouskop, D., Silliphant, L., Houle, J., Anderson, P., and Lepain, D., "Preliminary engineering and geological evaluation of remaining Cook Inlet gas reserves," State of Alaska Department of Natural Resources, Division of Oil and Gas and Division of Geological and Geophysical Surveys, December 2009.
7. Thomas, C., Hite, D., Dought, T., and Bloomfield, K., "Cook Inlet Natural Gas Reservoir & Storage," SAIC Cook Inlet Gas Storage ANGDA-RFP No. 2008-0400-7351, Alaska Department of Revenue and Alaska Natural Gas Development Authority, 2007.
8. Northern Economics Inc., "In-state Gas Demand Study Vol. 1: report prepared for TransCanada Alaska Co. LLC," January 2010.
9. Enstar, "Alaska In-state Gas Pipeline Project: presentation to the commercial working group," Oct. 28, 2009.
10. Reynolds, D., "Alaska and North Slope Natural Gas: Development Issues and US and Canadian Implications," University of Alaska-Fairbanks, 2003.
11. Northern Economic Research Associates, "Alaskan Gas Pipeline Models," 2002.
12. Rui, Z., Metz, P.A., Reynolds, D.B., Chen, G., and Zhou, X., "Historical Pipeline Construction Cost Analysis," International Journal of Oil, Gas, and Coal Technology, Vol. 4, No. 3, pp. 244-63, July-September 2011.
13. Rui, Z., Metz, P.A., and Chen, G., "An Analysis of Inaccuracy in Pipeline Construction Cost Estimation," International Journal of Oil, Gas, and Coal Technology, Vol. 5, No. 1, pp. 29-46, January-March 2012.
14. Rui, Z., Metz, P.A., Chen, G., Reynolds, D.B., Wang, X., and Zhou, X., "Inaccuracy in Pipeline Compressor Station Construction Cost Estimation,' SPE-160119-PP, SPE Annual Technical Conference and Exhibition, San Antonio, Oct. 8-10, 2012.
15. Energy Project Consultants LLC, "Technical team: Analysis of TransCanada AGIA Application," May 16, 2008.
The author
Zhenhua Rui ([email protected]) is a research analyst at Independent Project Analysis Inc, Ashburn, Va. His research interests includes energy and mineral resource valuation and project evaluation, market and transport analysis for energy and mineral resources, reservoir engineering, economic analysis, data analysis, optimization, and model simulation. He earned a PhD in energy and mineral engineering management, an MBA, and an MS in petroleum engineering from the University of Alaska-Fairbanks. He also holds an MS in exploration geophysics from China University of Petroleum-Beijing. Rui is a member of the Society of Petroleum Engineers and the Society for Mining, Metallurgy, and Exploration.
