Surplus anticipated in 2025 global oil market
Global oil supply section updated Jan. 17 to reflect Jan. 10 sanctions on Russia.
On Dec. 5, 2024, OPEC+ announced another 3-month delay to its planned oil output increases, the third deferral, pushing the timeline to April 2025 and prolonging the complete unwinding by a year to December 2026. These decisions indicate concerns over weak global demand and increasing production from non-OPEC+ producers. They also show that OPEC+ is unwavering in its strategy to manage oil price expectations.
The OPEC+ decision has materially curtailed the potential supply overhang anticipated for 2025. However, ongoing overproduction by some OPEC+ members, strong supply growth from non-OPEC+ countries, and modest global oil demand growth suggest the market will still be well-supplied in 2025.
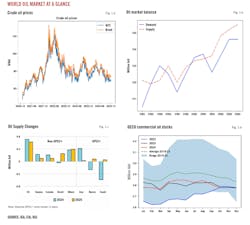
According to the International Energy Agency (IEA), if OPEC+ implements the plan to lift voluntary production cuts starting in April 2025, the global oil market surplus will reach 1.4 million b/d in 2025; but even if OPEC+ withholds the phasing out of cuts, the surplus will still reach 950,000 b/d.
Meanwhile, OPEC+ production cuts have bolstered non-OPEC+ producers and reinforced the US's position as the leading energy exporter. Key non-OPEC+ countries like the US, Brazil, Canada, Guyana, and Argentina could collectively increase crude oil and NGL output by over 1.1 million b/d in 2025.
In November 2024, Donald Trump won the US presidential election by a landslide. On one hand, Trump declared his intention to once again wield tariffs, posing a significant blow to global trade and creating a macroeconomic downside for 2025 oil demand. On the other hand, he pledged to actively encourage exploration, development, and production of US fossil energy. These points can be self-contradictory.
On the oil demand side, the IEA forecasts growth of about 840,000 b/d in 2024 and about 1.1 million b/d in 2025, marking a significant slowdown compared with 2022 and 2023. The slowing growth reflects waning post-pandemic demand recovery, challenging global economic conditions, rising trade frictions, as well as competition from biofuels, EVs, and natural gas.
Notably, the course of the ongoing Middle East conflict and OPEC+ members’ willingness to adhere to voluntary production cuts remain major uncertainties to short-term oil supply and price forecast.
Global oil demand
The OECD's latest Economic Outlook suggests that the global economy will remain robust despite notable challenges. It projects global GDP growth of 3.3% in 2025, up from 3.2% in 2024 and 2023, and 3.3% again in 2026. Inflation has declined further towards central bank targets.
Growth prospects vary widely by region. In the US, GDP growth is expected to be 2.8% in 2025, slowing to 2.4% in 2026. In the euro region, growth is driven by recovering household incomes, tight labor markets, and lower policy interest rates, with projected GDP growth of 1.3% in 2025 and 1.5% in 2026. Japan's growth is forecast to reach 1.5% in 2025 before declining to 0.6% in 2026. China's growth is anticipated to continue slowing, with GDP growth of 4.7% in 2025 and 4.4% in 2026.
Meantime, the 2024 global manufacturing PMI peaked at 51% in May, trending lower after that. This macroeconomic indicator suggests that oil demand is under pressure, and the crack spreads for gasoline and diesel rapidly weakened in the year’s second half.
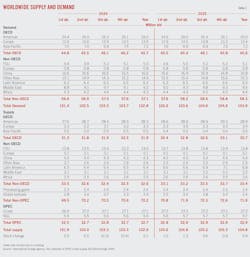
The IEA projects that global oil demand is set to increase by 840,000 b/d in 2024, a rate that is slower than in prior years (e.g. 2 million b/d in 2023), bringing total consumption to 102.8 million b/d. In 2025, growth is expected to pick up slightly, with an increase of 1.1 million b/d, resulting in a total demand of 103.9 million b/d.
From a macroeconomic perspective, fossil energy is still the main component of global primary energy. The development of renewable energy is not synchronized globally, leading to gradual and unstable changes in the energy landscape.
Gains in 2025 will be dominated by naphtha, LPG, and ethane, driven by robust steam cracker margins and petrochemical capacity additions. Demand for transport fuels remains subdued.
OECD countries demand remained flat at 45.7 million b/d in 2024 and is expected to decrease slightly in 2025. Demand growth in non-OECD countries is projected at 821,000 b/d in 2024 and 1.16 million b/d in 2025.
The US showed robust ethane and LPG consumption in 2024, compensating for gasoil’s weakness. Canadian consumption is declining in 2024, mirroring the slowdown in the country’s GDP growth.
European countries like Spain show gains, but overall regional growth is muted. Manufacturing slumped in major economies like Germany, where demand for industrial inputs like gasoil and naphtha remains subdued.
In Asia, Korea posted notable growth in petrochemical demand, particularly naphtha. Japanese demand continued declines due to demographic challenges.
Emerging Asia, including India and parts of Southeast Asia, leads global growth. Strong growth in these countries compensated for slower demand in China, where economic challenges and a transition to cleaner technologies are prominent. Middle Eastern demand is bolstered by increased LPG/ethane usage, brought by petrochemical industries.
India is poised to lead global growth in 2024, with an increase of 200,000 b/d, or 3.6%. Gasoline and LPG/ethane are leading demand growth, driven by agriculture, travel, and government incentives. However, recent indicators suggest a slowdown in growth. Third-quarter 2024 GDP growth fell short of expectations at 5.4%, and the HSBC India Manufacturing PMI slightly decreased to 56.5 in November 2024 from 57.5 in October. Despite this, Indian demand growth is still projected to accelerate in 2025, increasing by 220,000 b/d, due to higher fuel consumption.
China has been the driving force behind the growth in global oil demand over the past 25 years. However, China’s demand contracted for much of 2024 due to structural economic challenges, including a property slump. Meantime, the increased penetration of renewable energy vehicles in place of gasoline consumption, along with LNG heavy trucks replacing diesel, has impacted the growth of oil consumption in China. A total demand increase of 140,000 b/d in 2024, reaching 16.6 million b/d, is primarily driven by rising petrochemical feedstock needs, with naphtha and LPG/ethane collectively up by 180,000 b/d. This trend is expected to continue into 2025.
Notably, the other two major institutions, the US Energy Information Administration (EIA), and OPEC, have significant differences in their oil demand assessments. According to OPEC's November report, it believes global oil demand in 2024 could reach 104 million b/d, with an increase of 1.8 million b/d year-on-year (y-o-y), and projects demand in 2025 to reach 105.6 million b/d, increasing by 1.5 million b/d. The EIA estimates that global oil demand in 2024 could be 103.1 million b/d, rising by 990,000 b/d y-o-y, and in 2025, it could reach 104.35 million b/d, with an increase of 1.22 million b/d. Clearly, OPEC is the most optimistic about global oil demand growth, with significant overestimation for 2024 demand.
Global oil supply
According to IEA, annual global oil supply increased by an estimated 630,000 b/d y-o-y to 102.9 million b/d in 2024 and is projected to rise by an additional 1.9 million b/d in 2025 to 104.8 million b/d.
Notably, this estimate does not account for OPEC+’s return to higher production given the uncertainty about when the group will begin phasing out these cuts, despite some countries already producing above their targets.
Based on this assumption, non-OPEC+ is anticipated to contribute over 70% of the growth in 2025, primarily from increased supply in the Americas. OPEC+ could add about 460,000 b/d, mainly from additional NGL and condensate volumes, assuming no changes in OPEC+ voluntary crude reductions. Should OPEC+ start unwinding cuts in April 2025 to the new, slower schedule, the group could add a further 460,000 b/d to the market on average in 2025.
Among the core OPEC producers, including Saudi Arabia, Kuwait, and Algeria, fiscal break-evens have generally increased over the past 5 years, according to calculations of the International Monetary Fund (IMF). High fiscal breakeven levels are often viewed as supporting OPEC's ongoing efforts to stabilize the oil market and prices.
Disrupted or sanctioned regions like Iran, Libya, and Venezuela continue to be significant variables in OPEC+'s supply dynamics. Under a second Trump term, Iranian oil supply risks are likely tilted towards reduction. The risks for Venezuela seem to trend downward from an already low supply. These risks of further reductions in Iranian and Venezuelan supplies in 2025 might open doors for other OPEC producers, particularly Saudi Arabia, to increase supply.
From March to April 2022, Russian crude oil production fell to 9.1 million b/d from 10 million b/d and recovered to 9.74 million b/d by June 2022. As of November 2024, production was 9.25 million b/d.
After 2022, Russia's oil exports to Europe and North America significantly declined, while exports to other countries substantially increased, leaving its actual export volume largely unaffected. On Jan. 10, the US government issued new, expansive sanctions, particularly on the 'shadow fleet', intended to reduce revenues from the Russian oil sector.
Sanctions on Iranian oil by Europe and the US in recent years have focused on the Joint Comprehensive Plan of Action (JCPOA). Strengthened sanctions from late 2011 to mid-2012 led to a decrease in crude oil production by 991,000 b/d from January 2011 to October 2012. In July 2015, the JCPOA was concluded, and economic sanctions on Iran were eased, resulting in production increasing by 764,000 b/d from July 2015 to June 2016.
In May 2018, Trump announced the US withdrawal from the JCPOA, causing production to drop by 1.09 million b/d from May 2018 to January 2019. On Oct.1, 2024, with rising tensions between Israel and Iran, the US government announced further expansion of sanctions on Iranian oil and gas. If Iran's production increases are reversed due to heightened sanctions, it might counteract the pressure on oil prices from OPEC's production increases.
An escalation in the Middle East regional conflict has potential to reduce oil supplies, and regional political uncertainty can increase the risk premium. Meantime, although OPEC+ producers will likely continue to limit production in 2025, the potential for weakening commitment among OPEC+ producers to continue cutting production adds downside risk to oil prices.
Notably, the start-up of Saudi Aramco’s Jafurah gas project next year will also boost Saudi Arabia’s NGL supply. Kazakhstan’s 260,000 b/d Tengiz expansion will also come online in 2025.
Non-OPEC+ supply is projected to average 53.1 million b/d in 2024 and 54.6 million b/d in 2025, representing an increase of nearly 1.5 million b/d y-o-y each year.
Efficiency and productivity enhancements have significantly contributed to US shale's impressive growth, with ongoing advancements in the crucial Permian basin. Currently, a rig operating in the Permian basin is about 4-5 times more productive than its counterpart from a decade ago.
Brazil's underperformance in 2024 has been due to increased downtime, partly aggravated by a labor action at the environmental regulator, causing severe delays in permitting and operations. However, despite these challenges, significant offshore capacity expansion is anticipated to bolster Brazilian oil growth in 2025.
Canadian production growth will continue to benefit from the increased egress from Alberta via the Trans Mountain Expansion (TMX) pipeline. This 590,000 b/d pipeline expansion nearly triples the original Trans Mountain pipeline’s capacity, bringing the pipeline to a capacity of 890,000 b/d, significantly expanding access to Canada’s Pacific Coast, then the US West Coast and Asia.
After dipping 20,000 b/d in 2024, Norway’s total oil production in 2025 will be underpinned by the Johan Castberg project.
Global oil inventories
At the end of October 2024, OECD industry inventories fell to 2,778 million bbl, standing 91.6 million bbl below the 5-year average. By region, total oil inventories in the US, excluding the Strategic Petroleum Reserve (SPR), reached 1.24 billion bbl in mid-December, with commercial crude and Cushing inventories both at near 5-year lows. In Europe, Middle distillates industry inventories stayed higher than 5-year averages for 2024, pointing to a well-supplied market.
OPEC+ production cuts have contributed to global oil inventory withdrawals in second-half 2024. However, continued supply growth outside of OPEC+ will lead to an average inventory build for the entire 2025, putting downward pressure on crude oil prices.
According to conservative forecasts of OPEC's crude oil production, along with the IEA's predictions for demand and non-OPEC supply, global oil inventories are projected to rise by around 900,000 b/d this year.
US oil demand
The US economy is in a favorable position. Concerns about a recession have subsided, inflation is approaching the 2% target, and the labor market has adjusted while maintaining its strength. However, labor shortages and higher tariffs could pose downside risks.
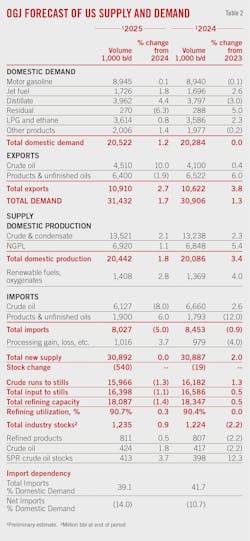
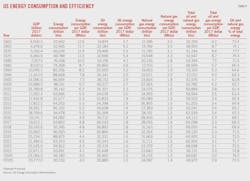
US petroleum and other liquid fuels consumption in 2024 remained largely flat with the 2023 level, around 20.28 million b/d, according to preliminary data from EIA. OGJ forecasts that total US petroleum and other liquid fuels consumption will average 20.5 million b/d in 2025, an increase of 1.2% from the 2024 level. Increased consumption of distillate fuel is the primary driver for the growth, due to an improving macro and manufacturing outlook.
In 2024, US motor gasoline consumption remained nearly the same as in 2023. Data from the US Federal Highway Administration show vehicle miles reached a record seasonal high in third-quarter 2024, up nearly 1% y-o-y. However, more efficient car engines and a growing EV fleet are reducing gasoline demand. The share of all-electric and hybrid vehicles rose to a record 21.1% of new light-duty vehicles sold in third-quarter 2024, according to EIA data.
OGJ forecasts US motor gasoline consumption will stay flat in 2025, as the gap between mobility and fuel use continues to grow. Despite strong mobility, better engine efficiency and increasing electric vehicle adoption continue to lower gasoline demand.
Estimated US consumption of HGL averaged 3.59 million b/d in 2024, up 2.3% from 2023, thanks to the positive margin environment for steam cracking. OGJ forecasts that US consumption of HGL will rise 0.8% in 2025.
US distillate fuel consumption for 2024 is estimated to have averaged 3.8 million b/d, down 3% from a year ago. The contraction reflects muted manufacturing activity, lackluster freight transport, and warm weather. According to data from the US Bureau of Transportation Statistics, trucking freight year-to-date, as measured by the truck tonnage index (seasonally adjusted), declined 1% in 2024. OGJ expects that distillate fuel consumption will increase to 3.96 million b/d in 2025, due to a favorable macroeconomic and manufacturing outlook.
Estimated US consumption of jet fuel averaged 1.7 million b/d in 2024, compared with 1.65 million b/d in 2023. OGJ expects that it will increase 1.8% to 1.73 million b/d in 2025.
US oil production
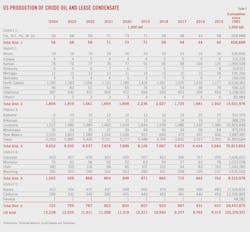
In 2024, despite impacts from very active hurricane seasons, estimated US crude oil production averaged 13.24 million b/d, a 2.3% increase from 12.94 million b/d in 2023. This follows growth of 7.9% in 2023 and 6.1% in 2022, securing the US’s position as the world’s top producer of crude oil for the seventh consecutive year.
Production is projected to climb to 13.5 million b/d in 2025, fueled by heightened output from regions like the Permian basin and offshore initiatives.
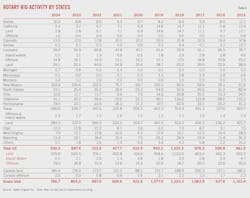
The US active rig count has been declining since late 2022. In December 2024, US firms increased the number of active oil and gas rigs for the first time in 8 weeks, adding 7 rigs to reach a total of 589. This count, however, remains 6% lower than the same period in 2023, reflecting cautious investment strategies amid market volatility.
Despite a decrease in the number of active rigs, US crude oil production has been on the rise. Advances in horizontal drilling and hydraulic fracturing technologies have significantly increased well productivity, mitigating the lower activity level. These innovations have been crucial for US crude oil production growth, allowing producers to extract more crude oil from new wells drilled and sustain volumes from previously drilled legacy wells.
Since the beginning of 2023, the Permian basin has maintained a higher number of active rigs compared with the rest of the Lower 48 states, successfully completing hundreds of wells each month. In the Permian region, output from newly completed wells has grown consistently over the past 2 years.
Enbridge has notably announced an expansion of its Gray Oak pipeline to boost takeaway capacity from the Permian by 120,000 b/d by yearend 2025.
Increasing crude oil production has gone hand in hand with effective cost management. An analysis by the EIA of 34 publicly traded oil companies, which primarily produce crude oil in the US, found that their upstream capital expenditure has averaged about $21/boe in real terms since mid-2022. During this period, crude oil production from these exploration and production (E&P) companies rose by 21%. In contrast, in 2019, these E&P companies had an average cost of $32/boe.
US NGL production grew 5.4% in 2024 to 6.85 million b/d, reaching a record high. NGL production is set to increase 1.1% to 6.92 million b/d in 2025.
Combined, US total domestic oil production in 2025 is expected to rise 2% from a year ago to 20.4 million b/d.
US refining
The US refining sector experienced one of its weakest years in 2024, with declining profits and weakened refining margins due to softened fuel demand. Despite this, US refining is expected to maintain its competitive edge thanks to access to cost-advantaged domestic crude supplies and inexpensive natural gas.
In 2025, new refineries, especially in Asia and the Middle East, along with completed maintenance activities, are expected to boost supply and keep crack spreads low. However, this challenging environment, in line with falling demand trends, is also causing numerous site closures, curbing supply growth.
Refining cash margins for the first 10 months of 2024, the latest data available, averaged $18.44/bbl for the Midwest, $16.69/bbl for the West Coast, $13.77/bbl for the Gulf Coast, and $7.74/bbl for the East Coast, according to Muse Stancil & Co. The average cash refining margins for these refining centers averaged $26.29/bbl, $27.46/bbl, $25.04/bbl, and $16.34/bbl respectively in 2023. For the same period in 2022, these refining margins averaged $34.51/bbl, $30.78/bbl, $28.72/bbl, and $22.34/bbl.
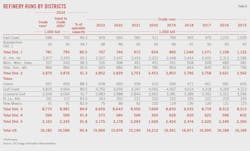
US crude runs averaged 16.18 million b/d in 2024, up 1.3% from the level of the previous year. Refinery utilization as a percentage of operable capacity averaged 90.4% in 2024, flat with the 2023 level. In 2025, crude runs will decline, driven by capacity closures.
In 2024, US refining capacity averaged 18.35 million b/d, up from 18.25 million b/d in 2023. However, in 2025, capacity is expected to decrease to 18.09 million b/d due to announced refinery closures.
Phillips 66 will shut its large Los Angeles-area oil refinery late in 2025, citing long-term market uncertainties. This will reduce California’s refining capacity to 1.5 million b/d, increasing its structural deficit in gasoline and jet fuel, and potentially eliminating much of the surplus in diesel.
Chemical maker LyondellBasell detailed its plan to permanently shutter its 263,776 b/d Houston refinery in first-quarter 2025. More closures are anticipated in the coming years.
US oil trade
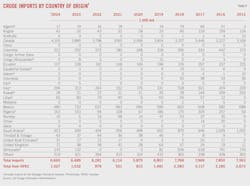
During this year's first three quarters, the US imported 6.62 million b/d of crude oil, compared with 6.5 million b/d for the same period a year ago. Crude oil imports from OPEC members averaged 1.01 million b/d, compared with 1.08 million b/d in the first three quarters of 2023. The US's crude imports from Saudi Arabia for 2024's first three quarters dropped to 298,000 b/d from 384,000 b/d for the prior year’s first three quarters. The leading source of US crude imports was Canada, which supplied 4.07 million b/d during the period.
US imports of crude oil from Canada are projected to hit a record high in 2024, driven by the expansion of Canada's Trans Mountain pipeline. The Trans Mountain Expansion (TMX) significantly increased the pipeline's capacity, tripling its previous 300,000 b/d limit when it commenced commercial operations in May 2024. This development facilitates the transport of additional crude oil from Alberta, a landlocked province, to Canada’s west coast for export. Meantime, due to slowing oil demand growth in China, US West Coast refiners have been major purchasers of these new export volumes.
According to EIA data, the US exported 4.1 million b/d of crude oil in the first three quarters of 2024, similar to the same period in 2023. The top destination for US crude oil exports was the Netherlands, followed by Korea, Canada, and the UK. Over the first 9 months of 2024, US crude oil exports to the Netherlands averaged 781,000 b/d, up 33.6% over the same period in 2023.
Notably, in the first three quarters of 2024, US crude exports to China averaged 247,000 b/d, down from 486,000 b/d during the same period a year ago. Exports to India averaged 237,000 b/d, an increase from 185,000 b/d a year ago. Exports to Korea averaged 504,000 b/d, up from 372,000 b/d a year ago. Exports to Canada averaged 358,000 b/d, compared with 340,000 b/d in the previous year.
Overall, US crude net imports in 2024 have remained close to 2023 volumes with increasing US crude oil production supplying an almost equivalent increase in US refinery runs. According to EIA’s forecasts, in 2025, US crude oil production is expected to keep rising even as US refiners process less crude than in 2024, resulting in net imports of crude oil dropping by over 20% to 1.9 million b/d, marking the lowest net imports since 1971.
For the first three quarters of 2024, petroleum products exports averaged 6.5 million b/d, an increase of 7.6% compared with the same period of 2023. Mexico was the major destination for US petroleum products exports, receiving 1.14 million b/d, or 17.6% of total US petroleum products exports. US petroleum products exports also went mostly to China, Japan, and Canada.
In the first 9 months of 2024, the US exported an average of 2.84 million b/d of HGL, an increase of 7.4% compared with the same period of 2023. The top destination for US HGL exports was China. US HGL exports to China averaged 550,000 b/d, up 23.5% over the same period in 2023, bolstered by China’s petrochemical feedstock demand. Aside from China, US HGL exports went mostly to Japan, Canada, and Mexico. The top destination for US propane exports was still Japan.
According to EIA data, the US exported 1.26 million b/d of distillate in the first three quarters of 2024, compared with 1.1 million b/d over the same period a year ago. Mexico received the largest share of US distillate exports at 273,000 b/d, followed by Chile at 109,000 b/d, and the Netherlands at 104,000 b/d.
The US exported an average of 770,000 b/d of gasoline in the first three quarters of 2024, a decline of 14.67 b/d (1.87%) from the same period of 2023. The top destination for US gasoline exports was Mexico. Over the first 9 months of 2024, US gasoline exports to Mexico averaged around 450,000 b/d, down 1.7% over the same period in 2023.
US petroleum product imports were 1.9 million b/d in the first three quarters of 2024, down from 2.1 million b/d in the same period of 2023. US petroleum product imports decreased from most countries, while imports increased from China and South Korea.
US oil stocks
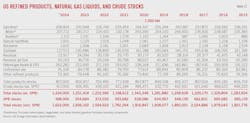
Estimated US commercial crude oil inventories were 417 million bbl at yearend 2024, down from 426 million bbl at yearend 2023 and near a 5-year low. Crude inventories in the Strategic Petroleum Reserve (SPR) were estimated at 398 million bbl at yearend 2024, up from 354 million bbl at yearend 2023.
Total product stocks at yearend 2024 were 807 million bbl, down from 825 million bbl a year ago. Motor gasoline inventories stood at 231 million bbl at end-2024, compared with 240 million bbl at yearend 2023 and near a 5-year low. Jet fuel stocks finished 2024 at 42 million bbl, up from 40 million bbl at yearend 2023, and estimated inventories of distillate fuel oil finished the year at 123 million bbl, down from 131 million bbl at yearend 2023.
After reaching a 6-year high in August 2024, US jet fuel stocks are expected to decline through 2025, reversing the upward trend of the past 2 years. In 2024, jet fuel consumption remained below pre-pandemic levels and decreased compared with 2023 in some months, leading to stock builds. Additionally, increased yields and production on the US West Coast contributed to record-high jet fuel stocks of the region in Summer 2024. In 2025, however, US jet fuel stocks are projected to decrease due to rising consumption and reduced refinery production following US refinery closures.
US natural gas market
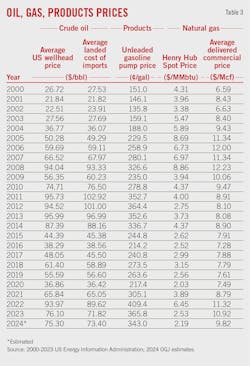
After reaching a high of $6.42/MMbtu in 2022, Henry Hub natural gas spot prices fell to $2.19/MMbtu in 2024 from $2.54/MMbtu in 2023. In 2025, prices are expected to exceed $2.90/MMbtu due to stronger demand for US LNG exports.
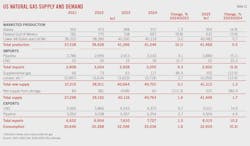
Estimated US consumption of natural gas averaged 90 bcfd in 2024, up 1.6% from a year earlier, according to the latest EIA data. In 2025, US gas consumption is expected to dip 0.3% y-o-y due to lower gas usage in the power generation sector.
In 2024, the power generation sector consumed an average of 37 bcfd of natural gas, representing 41% of total domestic consumption. This was up from 35.5 bcfd in 2023, which accounted for 40% of total consumption. In 2025, gas consumption in the power generation sector is expected to drop to around 35.4 bcfd due to the increase in power generation from renewable energy sources.
In 2024, residential and commercial gas consumption decreased by 3.32% and 0.33%, respectively, compared with 2023 levels. Combined, these two types of consumption account for 23.3% of total US gas consumption in 2024. A colder winter forecast suggests an increase in residential and commercial natural gas consumption during the 2024–25 winter heating season (November-March).
Industrial natural gas consumption averaged 23.3 bcfd in 2024, 0.3% lower compared with the 2023 level and accounting for about 26% of total domestic gas consumption. In 2025, industrial natural gas consumption is expected to remain largely unchanged.
US marketed gas production and dry gas production averaged 113 bcfd and 103.2 bcfd, respectively, in 2024. These represent decreases of 0.1% and 0.6%, respectively, from year-ago levels. Average monthly gas production peaked at 115 bcfd in February and has mostly ranged between 111 bcfd and 114 bcfd for the remainder of the year. Production cuts announced by natural gas producers early in 2024 led to reduced output from shale and tight formations compared with 2023. However, production in the Permian basin increased in 2024.
Driven by record low natural gas prices in early 2024, production in the Haynesville and Appalachia regions decreased as producers curtailed output until market conditions improved. In 2024, marketed gas production in the Haynesville decreased by 9% to 15 bcfd, while production in the Appalachia region fell by 1.6% to 35.3 bcfd.
Despite low natural gas prices, the Permian region continued to see growth in natural gas production due to its association with crude oil production. According to the EIA’s Drilling Productivity Report, Permian marketed gas production rose by 9.3%, reaching 24.8 bcfd in 2024, up from 22.7 bcfd in 2023.
Meantime, natural gas pipeline capacity from the Permian basin is set to increase. The 580-mile Matterhorn Express Pipeline, with a design capacity of 2.5 bcfd, has begun transporting natural gas from the Waha Hub in West Texas into Williams Cos.’s Transco pipeline, marking a significant enhancement to the midstream infrastructure serving the Permian basin.
Besides Matterhorn, three new pipeline projects in the Permian basin, with combined capacity of 7.3 bcfd, have been approved and are in various stages of development. Pipeline operators have also announced additional projects with a total capacity of 7.0 bcfd to transport natural gas from the Permian basin to demand centers in Mexico and along the Texas Gulf Coast. If completed, these projects could become operational between 2025 and 2028.
The added takeaway capacity should enable producers to boost natural gas deliveries out of the Permian basin, potentially increasing the price at the Waha Hub and narrowing or even reversing its price differential with the Henry Hub.
In 2025, US marketed natural gas production is projected to increase by 0.5%, driven by higher output in the Permian and Eagle Ford regions, where gas production is primarily associated with oil production. Additionally, increased production is anticipated in the Haynesville region due to higher natural gas prices and rising demand from new LNG export projects nearby.
US net natural gas exports in 2024 averaged 12.8 bcfd, which compared with 12.83 bcfd a year ago and was equivalent to 12.4% of total US dry gas production.
The winters of 2022 and 2023 in the Northern Hemisphere were exceptionally mild, which kept global natural gas markets well-supplied and balanced at relatively low prices. US LNG exports averaged 12.1 bcfd in 2024, largely flat with the 2023 level. However, the US is expected to export 13.7 bcfd of LNG in 2025, a 15% increase from 2024, thanks to stronger demand from Asia and Europe.
LNG prices are expected to rise in 2025 as demand is projected to outpace supply. Average dry gas production dipped from 2023 to 2024 as companies reduced production to counteract record low prices. Additionally, less natural gas could be supplied by pipeline to Europe if the Russia-Ukraine natural gas transit contract set to expire at end-2024 is not renewed.
Moreover, a transition from an El Niño to La Niña weather pattern could lead to colder temperatures, heightening demand and competition for LNG in Europe and Asia.
US pipeline exports of natural gas to Mexico averaged around 6.5 bcfd in 2024, compared with an annual an average of 6.14 bcfd in 2023. Much of the recent growth is attributed to increased US exports out of the Permian basin in western Texas as new pipelines were installed. Estimated US natural gas exports to Canada through pipeline averaged 2.7 bcfd in 2024, compared with an annual average of 2.1 bcfd in 2023. US pipeline gas exports are expected to continue growing in 2025 and the coming years, driven by increased flows to Mexico as more power generation comes online.
Working natural gas storage in the Lower 48 states closed the injection season with 3,922 bcf, according to EIA estimates. This means that US natural gas inventories are entering winter 2024–25 with the highest levels since 2016, sitting 6% above the 5-year (2019–23) average.
This occurs despite below-average injections into storage for the entire injection season spanning Apr. 1 to Oct. 31. Nearly every week in the 2024 injection season saw less natural gas injected than the 5-year average, partly because starting inventories were relatively full. Meanwhile, low natural gas prices in 2024 led producers to cut back on production, thereby decreasing the natural gas available for injections.
According to EIA, natural gas inventories will total 1,920 bcf at the end of March 2025, which would be still 2% more than the 5-year average. However, the storage surplus to the 5-year average will narrow during the winter.
About the Author
Conglin Xu
Managing Editor-Economics
Conglin Xu, Managing Editor-Economics, covers worldwide oil and gas market developments and macroeconomic factors, conducts analytical economic and financial research, generates estimates and forecasts, and compiles production and reserves statistics for Oil & Gas Journal. She joined OGJ in 2012 as Senior Economics Editor.
Xu holds a PhD in International Economics from the University of California at Santa Cruz. She was a Short-term Consultant at the World Bank and Summer Intern at the International Monetary Fund.
Laura Bell-Hammer
Statistics Editor
Laura Bell-Hammer is the Statistics Editor for Oil & Gas Journal, where she has led the publication’s global data coverage and analytical reporting for more than three decades. She previously served as OGJ’s Survey Editor and had contributed to Oil & Gas Financial Journal before publication ceased in 2017. Before joining OGJ, she developed her industry foundation at Vintage Petroleum in Tulsa. Laura is a graduate of Oklahoma State University with a Bachelor of Science in Business Administration.
