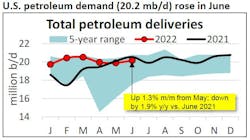
US petroleum demand, as measured by total domestic petroleum deliveries, was 20.2 million b/d in June, according to the latest monthly statistical report by the American Petroleum Institute (API). This reflected an increase of 1.3% seasonally from May, which was less than half of the average seasonal increase of 2.7% per year between May and June between 2012 and 2021. The 20.2 million b/d in June also reflected a decrease of 1.9% y/y compared with June 2021, the largest percentage gap so far this year below 2021 monthly levels.
Gasoline motor gasoline demand (9.1 million b/d) continued to grow with the summer driving season. Consumer gasoline demand, measured by motor gasoline deliveries, was 9.1 million b/d in June. With the summer driving season, this reflected an increase of 0.4% from May, but lagged the average 2.9% seasonal increase seen between May and June in 2012-2021. The 9.1 million b/d of demand was also down 2.3% y/y compared with June 2021—a third straight month in which gasoline trailed its year-ago levels and coincided with historically high monthly US nominal gasoline prices, API said.
Distillate demand rose along with freight trucking. Distillate deliveries of 3.9 million b/d increased by 2.4% m/m from May but were down by 0.7% y/y compared with June 2021.
Kerosene-type jet fuel deliveries of 1.6 million b/d in June rose by 2.5% m/m from May and 15.4% y/y compared with June 2021 to their highest for any month since January 2020. High-frequency data from Flightradar24 and TSA showed that the total number of passenger and cargo flights increased by 7.8% m/m, while air passenger volumes rose by 4.8% m/m. The International Air Transport Association (IATA) also reported international air travel has rebounded and air cargo was buoyed by eased Omicron-related restrictions in China, according to the report.
Deliveries of residual fuel oil were 300,000 b/d in June, which reflected a decrease of 20.6% m/m from May but an increase of 2.1% y/y versus June 2021.
Deliveries of refinery and petrochemical liquid feedstocks—naphtha, gasoil, and propane/propylene—were 5.1 million b/d in June, the second-highest reading for June since 2006. This reflected an increase of 3.5% m/m, but a decrease of 7.9% y/y compared with June 2021, which likely reflected continued emergence from the pandemic and consequently lower demand for medical plastics, films, and packaging, API said.
US crude production
US crude oil production of 12 million b/d in June increased by 1.1% m/m from May and 6.5% y/y compared with June 2021. This remained 900,000 b/d below the highest US crude oil production, which reached almost 13 million b/d in November 2019.
Through first-half 2022, US crude oil production averaged 700,000 b/d above that of the same period in 2021. Baker Hughes reported 587 active oil-directed rigs in June, a 3.2% m/m (18 rigs) increase from May, but 29.1% less than the 790 rigs that ran in June 2019, which as a benchmark preceded the strongest US crude oil production later that year.
Natural gas-directed drilling rose by 2.8% m/m (4 rigs) to 153 rigs in June at the same time as natural gas futures prices in June at Henry Hub exceeded $7.50/MMbtu for every delivery month through February 2023. NGL production rose by 2.5% m/m to 5.7 million b/d, its highest level for the month of June on record since 1973.
Trade, refining
US petroleum exports—crude oil and refined products—of 9.5 million b/d in June were the highest for the month on record for any month since 1947. Consequently, the US remained a petroleum net exporter of 800,000 b/d in June and averaged net exports of 900,000 b/d through first-half 2022, API said.
US refining gross inputs and capacity utilization rates are at their highest since 2019. In June, US refinery throughput, measured by gross inputs into crude distillation units, was 16.9 million b/d and implied a capacity utilization rate of 94%. The throughput and capacity utilization rates rose by 2% m/m and 1.8% m/m, respectively, from May. June marked the highest capacity utilization rate since August 2019 and the highest gross inputs since December 2019, the report said.
Inventory
US crude oil inventories rose by 1.3% m/m from May but were down 5.6% y/y vs. June 2021 to 422.8 million bbl, the lowest for the month since 2014. Total petroleum inventories, including crude oil and refined products (but excluding the Strategic Petroleum Reserve) of 1.16 billion bbl rose by 0.2% m/m from May but were down by 9% y/y compared with June 2021, also their lowest for the month since 2014.
