Study finds Haynesville refracs lift production
Todd Bush
Boyd Skelton
David Haas
Energent Group
Houston
Low oil prices have forced operators to seek alternative techniques to increase production while reducing capital expenditure. Refracturing fits these criteria in unconventional plays.
Hydraulic fracturing has focused generally on optimizing the components of the initial fracture job, such as the type of proppant, amount of water, and number of stages. Optimization efforts are now shifting to refracturing (refracs).
This article examines refracturing in Louisiana's Haynesville shale, using data collected from 32 wells operated by six different companies. The study found compelling evidence for refracs, including production uplift and favorable economics.
Study parameters
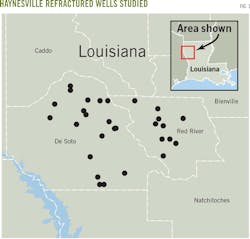
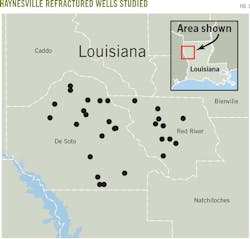
The Haynesville wells studied (Fig. 1) were:
• Horizontal.
• Completed 2009-11.
• Using a chemical or mechanical diversion to refrac.
• Generating production data that could measure the refrac's impact.
Analyzing the data from these Haynesville wells informs the discussion of refrac production yields, optimal refrac timing, and its economics.
Refrac production, timing
A comparison of average monthly production data for the first 3 months after a well's initial completion and its refrac showed post-refrac 3-month production rates at about 38.9% of initial completion, or 688-3,600 Mcfd depending on the well.
It is reasonable to expect the 3-month initial production and subsequent 3-month refrac production to have some relationship. Sample data, however, shows no statistical relationship between the production timeframes. Bigger wells don't yield better refracs.
Sample study data shows one factor as critical to refrac optimization: the lag, or number of days, from initial completion to refrac. There is a positive correlation between the timing of the refrac relative to initial completion and production uplift.
As the timing of the refrac moves further from initial completion, refrac production yield increases.
It is unreasonable to expect this positive relationship doesn't hold over the 20-30 year life of the well, but there is evidence from the study's sample that timing is a significant component in the optimization of the refrac.
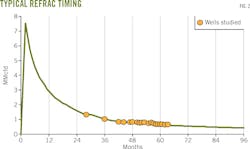
The timing in this study from initial completion to refrac was 856-1,920 days. Average timing of the refrac was about 54 months (~1,620 days) after initial completion (Fig. 2).
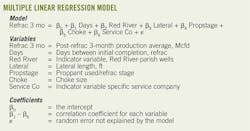
Statistical analysis of the sample data was completed using multiple linear regression modeling. The accompanying box shows post-refrac 3-month average production rates modeled as a linear combination of independent variables. A closer look at the model's variables tells us that:
• There is a positive correlation between the number of days between initial completion and refrac that would suggest there may be an optimal timing for the refrac.
• On average, the refracs in Red River parish produced better relative to De Soto and Sabine parishes.
• The implied drainage area of the well as measured by lateral length is a factor in the productivity of both the initial completion and the refrac.
• The amount of proppant used per stage of the refrac is a critical determinant of the refrac's effectiveness.
• Haynesville choke sizes and the shape of the play's type curve remain relevant to production.
• Sample-well operators used four different service companies, one of which had better refrac productivity.
The model uses these variables to predict refrac well performance. As more operators and service companies gain refrac experience, more data will lead to further refinement of this initial model.
Refrac type curve
High-pressure areas and good vintage wells make the Haynesville an ideal play for refrac. To get an idea of what the refrac potential of the core area might be, a hypothetical refrac type curve was developed.
A type curve for the overall Haynesville shale sampled 1,365 wells in Desoto, Caddo, and Red River parishes, and excluded wells that had already been refraced. The study used average monthly production for the first 60 months of these wells and then applied an exponential curve to extend total well life to 30 years.
The refrac curve used average timing and production results from the refrac sample set. The average refrac occurred 54 months after initial completion. As noted, 3-month average production post refrac was 38.9% of the 3-month average following initial completion.
To simulate the timing of the refrac more precisely, the percentages of the first, second, and third-month initial production rates, relative to the 3-month average, were used to simulate mid-month timing of the refrac in the first month.
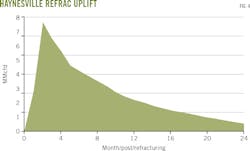
Post-refrac production data is too limited to form the basis of a well-decline model. The study instead used the decline rate of the first 24 months from initial completion to simulate post-refrac decline.
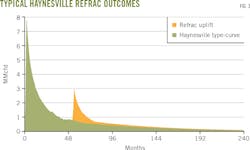
Applying an exponential decline rate, the study reached total well life of 30 years. Because we don't yet know how refrac wells will decline, the Haynesville type-curve decline rate served as an analog (Figs. 3 and 4). The study found that refrac uplift increases expected ultimate recovery (EUR) to 6.2 bcf compared to the Haynesville type curve's 5.3 bcf.
This conclusion opens more questions. Is production pulled forward (accelerated) or has the well produtivity increased yielding a higher EUR? Unless, however, the wellbore has been changed by adding new perforations or more stages, the EUR is unchanged, meaning production accelerated.
Haynesville refrac economics
Haynesville refrac costs depend on several factors, with each operator having unique land, operating, and overhead circumstances. For similar wells of similar depth, original cost was $7.3-13.4 million. With longer laterals, more stages, and more proppant, new wells will cost more than $10 million. Based on proppant and stage information, we estimate Haynesville refrac costs at $900,000-$2.8 million/well.
With gas prices around $2.75/ Mcf, refrac jobs are economically viable at $1.75 million. Refracs become unattractive at around $2 million. A gas price of $2.33/Mcf is needed for refracs to be considered in a company's portfolio mix.
Basic assumptions of an economic Haynesville refrac include:
• Production uplift forecast limited to 10-years.
• Inclusion of royalty, severance, and state and federal taxes.
• Average refrac cost = $1.75 million.
• Natural gas prices = ~$2.50/Mcf
• Discount rate = 10%.
• Inflation rate = 2%.
• No additional operating expenditures.
Break-even prices and refrac costs look attractive, yet operators are undecided about how Haynesville refracs fit into their portfolios. Assuming a new well costs $10 million, at that expense an operator could execute 5-6 refracs in much less time
Some Haynesville operators already are buying older assets and refracturing wells. As they continue to do so, the result set, experience, and industry knowledge will improve.
Using a limited sample set, there is compelling evidence to exploit the Haynesville's refrac potential. The economics of a refrac may outweigh the returns of drilling a new well. The majority of Haynesville refracs in the study used less proppant and water when compared with the original frac job. Lower refrac costs, faster cycle times, and quicker payback on capital all favor refracs over new production.
To gauge refrac potential in the Haynesville and elsewhere, timing, proppant amount, proppant type, number of frac stages, pressure pumper equipment, and fluid volumes must be considered in addition to traditional production data.
The authors
Todd Bush ([email protected]) is co-founder and principal of Energent Group. His experience includes lean operations, production surveillance and analysis, environmental compliance, and market strategy. Bush holds an MBA from the Rice University Jones School of Management, Houston, and an undergraduate degree from Texas A&M University.
Boyd Skelton ([email protected]) is co-founder of Energent Group. He most recently served as director of products and solutions and held other positions in corporate development, strategy, and marketing at Rignet. Skelton holds an MBA from the Rice University Jones School of Management and an undergraduate degree from the University of Texas at Austin.
David Haas ([email protected]) has worked in the oil and gas sector for more than 15 years, focusing on industry and market analysis. His experience includes various roles in strategy, supply fundamentals, competitive intelligence, royalty and production tax, and supply chain management. Haas holds an MA in economics from Virginia Tech University and an MBA from Clemson University, South Carolina.
