Special Report: Logical expressions a basic tool in reservoir characterization
In this research the basic aspects of applying logical expression as fuzzy logic to a seismic data set and its application in reservoir characterization are proposed.
In addition, the simple understanding, placement, and role of simple logical expressions will be briefly highlighted using examples. Combining a number of sections through fuzzy logic can not only enhance focus but also reveal insights and improve interpretation in a presentable way.
It is a general approach of meta-attribute visualization and interpretation of the seismic data by integrated techniques. One can create a number of sections describing specific objects, e.g. direct hydrocarbon indicators, sand cube, and carbonate cube (e.g., reef), based on transformed cubes (gamma ray, density, acoustic impedance, etc.).
Introduction
Logical expressions are mathematical treatments to the data set.
The functionality of utilizing such expression is normally available in mapping and other geoscientific software. To our knowledge simple logical treatment to a seismic data set has not yet been perfectly introduced for seismic object detection and reservoir characterization.
Dealing with seismic data at each sample value is basically an application of seismic attributes. Too many seismic attributes are available in literature since 1960,1 and most of them are redundant2 with general pitfalls in seismic attributes analysis.3
De Groot4 has highlighted the role and application of multiple attributes volumes in the industry standard solution of dGB Earth Sciences (OpendTect). Generally, three basic attributes, amplitude, frequency, and phase, can easily be extracted from seismic data, and any subsequent attribute available for interpretation is basically a derived attribute.
Many methods are available in the literature to combine several attributes by using fuzzy logic and neural networks as meta-attributes, such as the patented FaultCube5 and patented ChimneyCube6 methods.
For the case of general application of meta-attributes in reservoir characterization, the need is to have enough data, perfection, and enough knowledge to interpret the defined classes because the result is a combination of several input attributes.
The methods of combining several attributes (e.g., 1 dozen) by using supervised or unsupervised neural networks for particular purposes are actually very highly technical and superior. But before finalizing the results, one can create logical outputs by combining a number of interpreted attributes and visualizations with simple logic to reduce uncertainties.
On the other hand, sometimes an interpreter is unable to bridge the gaps between isolated information (attributes) and final resultant classes. Such gaps can be filled by using simple logical (IF-THEN) statements. Such techniques should be termed as “self-filtering techniques by using logical expressions.”
We are focusing logical expressions as self-filters because these are related to the interpreter’s knowledge of the data and the outputs are descriptive of the expression used for the specific subsurface feature.
Logical expressions
Zadeh7 first proposed the basic idea of using logical expressions as a fuzzy set.
Such sets can be combined by using AND/OR operators. The AND operator creates an output (e.g., true = 1) where both conditions satisfy equation 1, while the OR operator creates an output (e.g., true-1) where either condition satisfies equation 2.
Aminzadeh and de Groot8 have already sketched the application and role of fuzzy sets by using several approaches, mainly neural networks. The uses of such operators depend on the situation and the nature of the results to be filtered out.
The AND operator is generally applied in mandatory situations such as DHI indicators that can be expressed as logical conditions separated by an AND operator over high amplitude, phase reversal (180°), low frequency, etc.
A simple example of logical expression is highlighted in equation 3. In this expression a1, a2, and a3 are the input information (seismic attributes) and x1, x2, and x3 are the real respective values of input attributes.
This expression has been applied at seismic sample level to combine different results as a meta-result. That is an output which is a descriptive of a number of inputs. Thus a user can not only combine information but can also create new output by using such expressions that define a particular subsurface condition.
IF (condition 1) and (condition 2) then set 1 else 0 (eq-1)
IF (condition 1) or (condition 2) then set 1 else 0 (eq-2)
IF ((a1
Where expressions can stand
The recent advances in technology deal with the interpretation of a number of input seismic versions.
An interpreter generally works on different seismic versions (unmigrated stacks, migrated stacks, simple attribute cubes, spectrally decomposed, impedance cubes, predicted/inverted cubes, etc.). How many versions can one superimpose by setting transparencies just to invoke one reservoir character, e.g., just separating high risk areas and low risk areas?
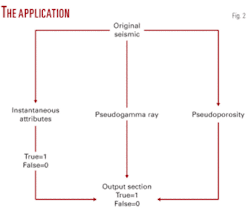
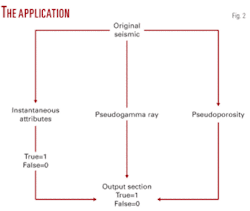
The answer to such question is not simple and direct. It is sometimes good and sometimes bad to interpret a cube/section that is descriptive of a number of acoustic properties. But if an interpreter wants to filter out selective information from each seismic input section/cube and he uses such filtered information as one output, the logical expression can resolve such problems. A simple case of such information has been highlighted in Fig. 2.
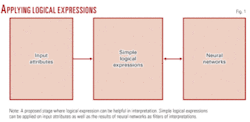
The logical expressions can help to resolve problems at any interpretation level. But their fuzzy role comes as a self-filtering method between input attributes and in prediction by using neural networks during key interpretational phases in reservoir characterization (Fig. 1).
In case of reservoir characterization from seismic data, the simple logical expressions can stand in between the application of neural networks and input attributes. The need of such expression increases when the number of input information increases, and such things happen when an interpreter integrates several techniques.
So prior to applying neural networks directly from such information a simple method of an IF-THEN clause sometimes reveals interpretable results. Even though neural networks and fuzzy logic are always fuzzy, the interpretation by using simple logics can provide enough insights. A way is proposed to simplify the results by applying simple logics over overlapping information. And the end result in such case would be unique, i.e., “true” where condition satisfies and “false” where condition fails to satisfy the results.
Building logic
A most general case is exemplified in this section to highlight the need and importance of simple logical expressions.
Fig. 2 describes a simple case of logical expression to combine several inputs as one descriptive output. The first idea is to use one or two seismic attributes and elaborate the role of such expressions as self filters. Thus amplitude and frequency instantaneous attributes are used as a filtered out example.
We will create new filtered output (frequency and amplitude limitation) as the object of our focus (Figs. 3 and 4). Moreover, if an interpreter has a transformed acoustic impedance cube, he can use such information at this step (besides amplitude and frequency), i.e., output of limited acoustic impedance range.
The basic theme of the presented data set (Netherlands F3 Block) and associated geological ideas is based upon the work of Overeem.9 The chronostratigraphic relationship of this block has already been discussed.10 11 12
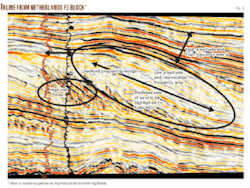
Let us build a simple logic from Fig. 3.
The large ellipse marks the area to be highlighted by using logical expressions. This area is predicted as good quality sands preservation with low amplitudes and intermediate frequencies as input acoustic information. Geologically the large ellipsoid marks the area of a lowstand prograding wedge.
The small ellipse marks the area of high risk, i.e., poor quality sand accumulation as compared to the area marked by the large ellipse. Our goal is to create an output that reflects:
- An average frequency of 0-50 Hz.
- Minimum positive amplitude range of 0-3,000.
- Fair to good predicted pseudoporosities.
- Low predicted pseudogamma ray values (Fig. 2).
Based upon such problem we will resolve two things at this point: Firstly, to highlight a low risk area with good quality sand prediction, and secondly, maybe we can quickly visualize the dispositional patterns in 3D volume.
The limitation at this point is that results lack low frequency information (acoustic impedance) and conditions would be separated by AND operator over frequency and amplitude.
Thus in either case, there would be highlighted areas with no sand information because of condition over amplitude and frequency. Such areas would be treated as areas that lack sands information with low gamma ray and porosity information.
Then in this case we will use two property cubes, i.e., pseudogamma ray and pseudoporosity cubes derived from neural networks. These cubes lack low frequency information, and appropriate prediction of such cubes is not necessary and beyond the scope of this research.
By knowing such limitations, the GR and porosity cubes are just highlighted as an expression, not as a true case. Moreover, we want to create an output at seismic resolution. For superior results anyone can create appropriate property cubes by minimizing low frequency limitations and then use simple logical expressions for self-filtered outputs.
Example:
An in-line from North Sea (F3 Block) has been shown in Fig. 3 with posted gamma ray (maroon) and porosity logs (black), respectively. Over this in-line the logical expressions are to be applied to present and highlight the areas of sand accumulation with respective conditions.
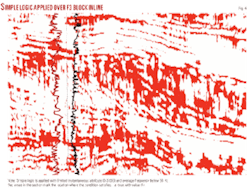
The first example is shown in Fig. 4 in which specific amplitude and frequency information (equation 2) are filtered out by using “AND” operator (&&). Equation 4 represents a case of creating a new seismic output (between 0 and 1) where both conditions (overamplitude and frequency) satisfy.
The case is to highlight the areas of input section with intermediate amplitude information and frequency information by assuming that sand will represent a low positive amplitude range and intermediate to low frequency. The predicted area (Fig. 3) shows a red colored clastic deposition with limited amplitude and frequency information (Fig. 4).
Notice that the red color misses the areas of high frequency and high amplitude information in high risk area (Figs. 3 and 4).
((x0 >0 && x0 <3,000) && (x1<50)) ? 1:0 (eq-4)
where x0 is instantaneous amplitude and x1 is average frequency.
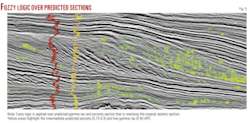
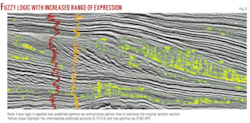
Another fuzzy logic (equation 5) has been applied over neural network predicted pseudoproperty cubes (gamma ray and porosity). This section has been shown in Fig. 5 as a yellow (true = 1) colored section overlying the actual in-line (gray scale). The areas are highlighted as predicted sands with limitation (equation 5).
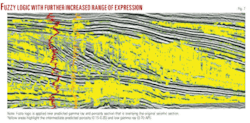
The same yellow color has been improved (Figs. 5 and 6) by increasing the range of expression (equation 5). By increasing the range of the condition, the resultant section is more pronounced, but still the low risk area (Fig. 3) does not show any good quality sand prediction.
((x0 < 50 API) && (x1 > 0.15 && x1 < 0.3)) ? 1:0 (eq-5)
where x0 = pseudogamma ray predicted section and x1 is pseudoporosity predicted section.
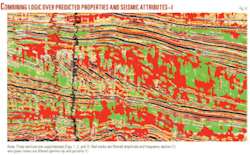
A fuzzy output has been created using Figs. 4 and 7, first by overlapping and then by using logical expressions. Fig. 8 describes the overlapped sections (Figs. 3, 4, and 7). The red areas mark the condition (equation 4) whereas green areas mark logically filtered gamma ray and porosity (equation 5).
As discussed earlier, it was assumed that the characteristic sand in the low stand prograding wedge (Fig. 3) would describe low amplitudes and intermediate frequency ranges at seismic resolution.
Now in Fig. 8, there are a few areas of sand hits that satisfy equation 4. But there are other areas highlighted (green) with acoustic information other than equation 4. One can derive too many conclusions from this section. The sand deposited at slopes (arrow marks) is a characteristic of average frequency ranging from 0 to 50 Hz and low amplitudes of 0-3,000, fair to good porosities, and low gamma rays.
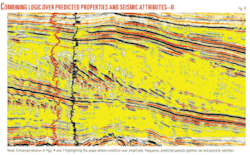
The same logical expressions are visualized as combine information in Fig. 9. The good sand hits (with limited amplitude and frequency) are clearly indicated by yellow color. If one wants to get this fuzzy output as in Fig. 6, they will have to change the parameters range of equations 4 and 5.
The same information can be visualized in 3D domain (Fig. 10). Notice how the stages of delta development are visualized that satisfy the logic applied of predicted pseudogamma ray and pseudoporosity cubes along with limited frequency and amplitudes. Such cube as in Fig. 10 is a descriptive of subsurface depositional patterns besides as a lithological cube.
One can develop such cubes by proper prediction of porosities and gamma ray which contain the information of acoustic impedance. The basic idea in this discussion is to invoke the role of logical expression and the way of utilization during interpretation.
Discussion
Simple logical expression can be used as a tool to create fuzzy outputs (0,1) at seismic sample value.
Such logics create new seismic output which can be descriptive of number of input seismic attributes, i.e. a fuzzy output. Such method of simple logical (IF-THEN) statement is basically a self-filtering technique of interpretation.
The integration of a number of technologies generates a number of output cubes/sections. One can use simple logical expression to define an expression for particular situation e.g., DHI. One can play with the parameter range until satisfactory results are achieved.
Moreover, we can use acoustic impedance information to create property cubes, and then we can use such logical expressions to take benefits in interpretation. Logical expressions are a strong tool to predict seismic objects, subsurface stratigraphic situation, depositional patterns, etc. It is up to an interpreter how he creates the input recipe to create such outputs.
The goal of the next millennium would be to develop new approximated cubes, for instance a sand cube, carbonate cubes (e.g., reef), etc. Such cubes can be approximated by simple IF-THEN statements.
Acknowledgment
We thank dGB Earth Sciences BV, Netherlands, for honoring OpendTect as a tool to generate such fuzzy results. Also we thank Fred Aminzadeh and Paul de Groot for publishing an extensive guide on fuzzy logic and soft computing techniques along with the public domain (F3 Block, Netherlands) data set used in this article.
References
- Chopra, S., and Marfurt, K.J., “Seismic attributes–a historical perspective,” Geophysics, Vol. 70, No. 5, 2005, pp. 3so-38so.
- Barnes, A.E., “Redundant and useless seismic attributes,” annual meeting selection, Geophysics, Vol. 72, No. 3, 2007, pp. 33-38.
- Sheline, H.E., “The use and abuse of seismic attributes,” Search and Discovery article #40143, 2005 (available online).
- De Groot, P., “Interactive multi-volume seismic attribute analysis in OpendTect,” Drilling & Exploration World, Vol. 15, No. 3, January 2006.
- De Rooij, M., and Tingdahl, K., “Meta-attributes–the key to multivolume, multiattribute interpretation,” The Leading Edge, 2002, pp. 1,050-53.
- Ligtenberg, H., and Connolly, D., “Chimney detection and interpretation–revealing sealing quality of faults, geohazards, charge of and leakage from reservoirs,” Journal of Geochemical Exploration, May 2003. Contribution to Geofluids IV, Fourth international conference on fluid evolution, migration and interaction in sedimentary basins and orogenic belts, Utrecht, the Netherlands.
- Zadeh, L.A., “Fuzzy sets,” Information and Control, Vol. 8, 1965, pp. 338-353.
- Aminzadeh, F., and de Groot, P., “Neural networks and other soft computing techniques with applications in the oil industry,” EAGE Book Series, 2006.
- Overeem, I., “Process-response simulation of fluvio-deltaic stratigraphy,” PhD thesis, Delft Technical University, 2002.
- De Bruin, G., and Bouanga, E.C., “Time attributes of stratigraphic surfaces, analyzed in the structural and Wheeler-transformed domain,” 69th EAGE Conference & Exhibition, June 2007, London.
- De Bruin, G., Hemstra, N., and Pouwel, A., “Stratigraphic surfaces in the depositional and chronostratigraphic (Wheeler-transformed) domain,” The Leading Edge, Vol. 26, July 2007, pp. 883-886.
- De Bruin, G., Ligtenberg, H., Hemstra, N., and Tingdahl, K., ”Synchronized sequence stratigraphic interpretation in the structural and chronostratigraphic (Wheeler-transformed) domain,” EAGE Research Workshop, Grenoble, France, Sept. 25-27, 2006.
The authors
Farrukh Qayyum is serving dGB Earth Sciences (Netherlands) as a case study geoscientist since April 2008. He is involved in sequence stratigraphic interpretations system (SSIS), object detection, and stratigraphic interpretation. He started in 2006 with Baker Hughes Inteq as a mud logger. After a year he joined Schlumberger-SIS as G&G technical assistant. He has an MSc in geophysics and an M.Phil with specialization in sequence stratigraphy and reservoir characterization from Quaid-i-Azam University.
M. Gulraiz Akhter ([email protected]) is an assistant professor in the Department of Earth Sciences at Quaid-i-Azam University. His areas of interest are exploration geophysics and numerical groundwater modeling. During his 20 years of experience, he has taught mathematics, geophysics techniques, and hydrogeology. He has a masters in geophysics and a PhD in hydrogeology from Quaid-i-Azam University.
Zulfiqar Ahmad is professor and chairman, Department of Earth Sciences, Quaid-I-Azam University. He worked as geophysicist/hydrogeologist with Saindak Metal for 7 years and developed the potential groundwater aquifers in the Tahlab Valley in northwestern Baluchistan near the Iran border. He carried out geophysical studies on electrical resistivity, gravity surveys, and geophysical well logging of boreholes in Tahlab. His work experience includes teaching, research, and administration. He has a PhD with specialization in numerical groundwater flow and solute transport computer modeling from the University of Kentucky, an MSc in hydrogeology from University College, and an MSc in geophysics with specialization in gravity prospecting from Quaid-I-Azam University.
