US SHALE OIL-GAS PRODUCTION POTENTIAL—2: Shales can greatly cut oil imports if US gas markets are developed
Richard S. Bishop
Rick A. Baggot
Wayne L. Kelley
Robert E. Fargo
RSK (UK) Ltd.
Houston
This is the second of three parts on the potential of domestic unconventional shale oil and gas production to displace oil imports to the US.
Choice of inputs
Growing the US gas market depends on factors such as license terms and amortization periods. For example, the amortization of most power plants is 30 years or more. In short, for there to be a market for additional gas production, new gas consuming and transporting infrastructure must be constructed and there must be enough gas for the long payback period.
Taking this into consideration in choosing the size of a rig fleet, we focused on one that would provide a production plateau of more than 30 years. Such a time frame is required to induce infrastructure and market development.
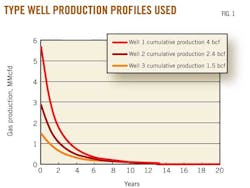
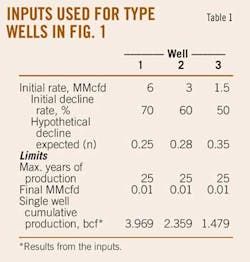
Fig. 1 and Table 1 illustrate the well decline rates and inputs used, respectively. These per well cumulative volumes are representative of the shale gas plays commonly being developed and are based on the literature,5 6 personal communications, and an expectation that future completions will be better than contemporary ones.
The major difference between wells is the initial decline rate. Importantly, this first stage very much influences subsequent production, regardless if it comes from initial rate, decline rate, or a few months' difference of duration.
The following graphs illustrate the results for developing about 1,000 tcf of shale gas resource.
This is somewhat larger than the mean resource estimates from the Potential Gas Committee (687 tcf)7 and the EIA (827 tcf),8 but it was chosen to be both within the range of uncertainty and to be a convenient resource volume for the reader to adjust to his needs.
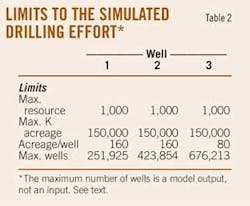
Table 2 shows the example simulation inputs presuming a total available resource (1,000 tcf) and total acreage to drill (150 million acres or about 234,000 sq miles) and well spacing.
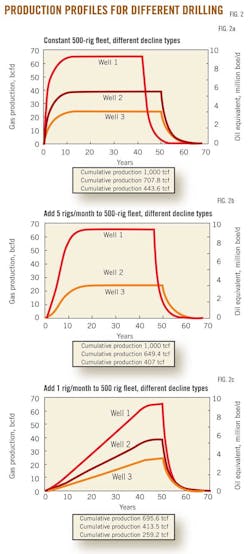
In this example (Fig. 2), the total resource is not recovered because the annual drilling was not modeled beyond 50 years. If the model had (1) a longer time period for drilling, or (2) higher recoveries per well, or (3) a larger total number of rigs or rigs added per month, or (4) a larger number of wells drilled per rig per month, or (5) more acres per well, then the model would have eventually reached other limits such as total resource volume or maximum acreage to drill.
Table 3 illustrates the drilling effort associated with the model. We input 500 rigs to the model. The number of rigs is a variable input.
Results
Fig. 2 A-C shows the production profiles for different drilling efforts and different decline rates using a resource assumption of 1,000 tcf.
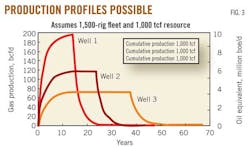
The right side of the graph illustrates the gas production in million barrels of oil equivalent of the gas production. Note the cumulative production in several cases is truncated by the 50-year period modeled. Production rate is approximately directly proportional to drilling effort so that doubling the drilling effort will approximately double the plateau rate but shorten the plateau duration in a nonlinear amount (see Fig. 3).
This series of graphs is helpful in considering ranges of potential US supply capacity. Given our assumptions, it is clear that the shale gas resource can contribute 60 bcfd (current US consumption rate) for several decades even with the low range of well productivity used. Presuming a fixed production plateau, when production rates attributable per well decline, proportionally more drilling is required.
Importantly, the scenarios modeled indicate that shale gas can significantly reduce imported oil provided there is a market. The US imports more than 9 million b/d of oil, and using shale gas for transportation can reduce those imports. Not only is shale gas cheaper to produce, but it provides domestic investment which enhances its value to the nation.9 10
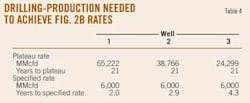
Table 4 summarizes the maximum rate and the time to achieve it. In addition it shows the time to achieve 6 bcfd (1 million boe/d).
Why volumes do not indicate rates
The sensitivity of well economics to initial production (IP, decline rate) is widely understood. That initial production also greatly influences the total supply rate for a fixed drilling effort.
The combination of drilling effort plus well performance in Fig. 2 A-C illustrates why unconventional resource volumes alone are poor indicators of future supply rate.
Implications to the US energy balance
There are many opinions today on how to supply US energy needs from conventional oil, natural gas, coal, nuclear, and renewable energy resources. Unfortunately, many of these opinions are based upon a total energy resource volume without amply considering the rate of supply. Given the gas resource as currently assessed, US production can be increased significantly.
How might a larger supply be used? What are some possibilities?
Currently in the US there is an emerging concern about the age of its coal and nuclear power plants and how to replace them. The average age of coal plants is over 40 years, and more than half of the nuclear plants are over 30 years old (as of the end of 2010). Thus, over the next 1 to 2 decades, the US will consider a variety of ways both to continue and to expand power generation.
Among the options for power generation will be the increased use of natural gas due its current cost advantages over oil, coal, and nuclear and the greater social-regulatory difficulties associated with building new coal and nuclear plants.
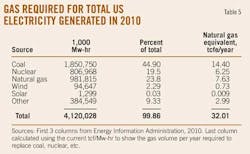
Table 5 illustrates the natural gas required to replace power from coal and nuclear plants.
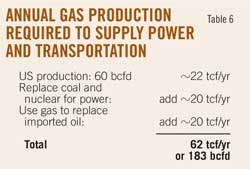
Replacing coal with natural gas would require 14.4 tcf/year, and to replace nuclear with natural gas would require an additional 6.25 tcf/year. Growth of power demand at 1%/year requires an additional 0.2 tcf/year. Table 6 lists estimates of the annual production increases to replace power with gas and to add natural gas for transportation.
Assuming a 1,000 tcf shale gas resource, it is physically possible to increase gas production by 20 tcf/year over a 50-year time frame. However, doing all three is not likely (Fig. 3), particularly due to limited plateaus.
In addition, there are physical, financial, and political limits to how much drilling can be added each year. We do not know what those limits are nor do we try to quantify them. Our purpose is to frame the challenge of increasing energy supply; others will decide based on the considerations of the day.
Costs
The estimated cost of a 500-rig program is $21 billion/year. Assume that this rig fleet drills 6,000 wells/year and an average cost of $3.5 million/well without any dry holes. Note that surface facilities and transportation costs are not included. The total cost of such a drilling program (which is truncated at 50 years) is $963 billion, which in several cases does not develop all the 1,000 tcf resource available.
Note also that the drilling effort of 500 wells/month is achieved after 21 years but continues at 500 wells/ month for 29 years in order to maintain the production rate. The model was arbitrarily limited to 50 years.
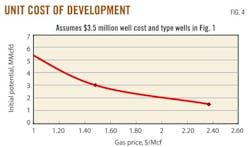
Using the declines illustrated in Fig. 1 and an average well cost of $3.5 million, production cost ranges between about $1-2.40/Mcf or $6/boe (Fig. 4). Clearly, the resource is not economic at $2.50/Mcf gas price and poor production rates.
Adding 1 million boe/d
There is much discussion today about replacing oil with natural gas for transportation.
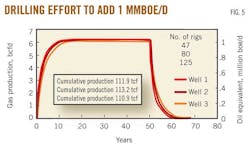
Fig. 5 illustrates the sustained drilling effort (i.e., number of rigs) necessary to add 1 million boe/d using the well declines shown earlier, and Table 7 shows the costs associated with the different size of rig fleets. Clearly, the cost to produce domestic natural gas is substantially cheaper than the current price of oil.
Note that 120 tcf can supply a sustained 1 million boe/d for nearly 50 years using the decline rates common to shale gas wells.
NEXT: Possible production rates from shale oil.
