Four examples show functions of wavelet energy absorption
WAVELET ENERGY ABSORPTION—3
This is the third of three parts on the use of wavelet energy absorption in direct hydrocarbon detection.
WEA method
At this point we have the necessary framework to combine all these concepts together into the wavelet energy absorption (WEA) method. But first, let us summarize the accumulated information.
1. The lithological information encoded into the seismic signal is contaminated and distorted by the reflecting boundaries. As a result, energy attenuation properties extracted from the seismic signal itself will tend to track strong reflectors.
2. The physical traveling wavelet is the carrier of lithological properties in its pure form.
3. The spectrum of the wavelet is sensitive to the energy attenuation caused by the squirt flow of liquid and the compression-decompression cycle of gas.
4. The zero- to dominant-frequency range of the wavelet spectrum is primarily sensitive to the squirt flow of liquid.
5. The liquid attenuation factor QL is directly proportional to permeability and inversely proportional to the density of the liquid. In principle this dependence allows for the discrimination between oil and water.
6. The dominant- to Nyquist-frequency range of the wavelet spectrum is primarily sensitive to gas.
7. The gas attenuation factor QG is directly proportional to bulk volume of gas.
8. Both attenuation factors QL and QG are functions of the traveling wavelet time-location. The background "attenuation" is evaluated and subtracted from both of these attenuation factors. Thus, two time functions for "gas" and "liquid" anomalous attenuation factors are generated on output.
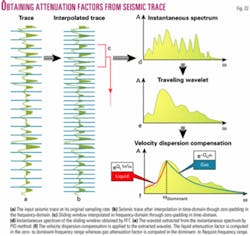
9. The length of the spectrum of the traveling wavelet is renormalized to a certain constant length in order to compensate for the effect of velocity dispersion.
10. Using the PID method, the traveling wavelet is extracted from the instantaneous spectrum.
11. The instantaneous spectrum is extracted from the short time-window sliding along the seismic trace.
12. The sliding window is zero-padded in the time-domain in order to increase the frequency resolution of its spectrum.
13. The spectrum of the entire seismic trace is zero-padded in the frequency-domain in order to decrease its sampling rate and therefore increase number of samples within the sliding window.
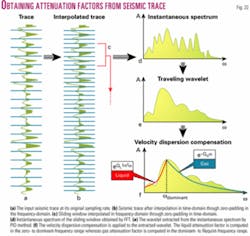
The computational procedure for obtaining attenuation factors QL and QG and from seismic trace is illustrated in Fig. 22.
Both attenuation factors are computed as a function of time. The background is extracted from both of these functions as shown in Fig. 20c. The anomalous attenuation factors digital data are generated in seismic data file format (SEG-Y) and at the original sampling rate. So, the output of this procedure is two SEG-Y files that contain the anomalous values of the liquid attenuation factor and the gas attenuation factor correspondingly.
WEA examples
The WEA method has been successfully used in and outside North America on both 2D and 3D, onshore and offshore, in many types of depositional basins, in rocks of all ages, in clastics and carbonates, and both shallow and deep.
Based on the application of WEA to dozens of data sets worldwide, WEA has been shown again and again to successfully match known well information (i.e., productive wells and dry holes), indicating the method is both robust and reliable in the direct detection of gas and oil reservoirs.
Four examples of WEA projects are discussed below.
The first example shows the application of WEA to identify a reservoir containing both gas and oil.
The second example illustrates the application of WEA in the carbonate environment to identify gas-charged reefs.
The third example shows how WEA was used to delineate a gas-charged meandering channel system in a deep, low signal-to-noise data set.
The fourth example is one in which WEA was used on 2D data to successfully predict a dry fault block which was then unfortunately proven to be dry by subsequent drilling.
For more examples and case histories of WEA application, see Lichman et al.11 and Peters, et al.12
Oil and gas reservoir
The first example shows the application of WEA in a clastic environment (Fig. 23.)
The vertical black line denotes the producing well (gas cap on top of oil leg). Both gas attenuation factor (panel b) and liquid attenuation factor (panel c) show the distinct gas and oil anomalies at the correct location.
Note that the strong seismic reflectors clearly visible on the seismic image (panel a) are completely ignored by the WEA method.
Gas detection in carbonates
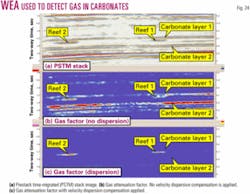
In this example, gas bearing reefs are embedded between two carbonate layers (Fig. 24).
The application of WEA analysis for gas attenuation factor without applying the velocity dispersion compensation is shown in panel b. As can be seen, very strong false "gas" anomalies are present in both carbonate layers. Panel c shows the gas attenuation factor with velocity dispersion compensation applied.
There are no false anomalies in the carbonate layers. On the other hand, strong gas anomalies are present in both gas-charged reefs.
Deep gas-charged meander channel
The third example of the application of the WEA method to detect hydrocarbons involves a project where a client had spent a number of years applying direct detection methodologies such as amplitude and AVA to an old, merged, low signal-to-noise 3D survey.
This work resulted in two deep expensive dry holes being drilled within the area.
The WEA result (Fig. 25) successfully imaged several gas-charged meander channels draped across a deep structural nose, and it also indicated that no productive reservoirs would have been expected at the dry hole locations.
Dry fault block
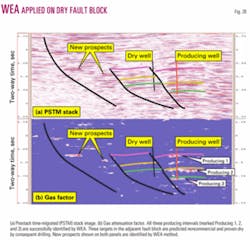
The fourth example of the application of WEA is in an offshore area where WEA was applied in advance of the drilling of a proposed well to test a fault block adjacent to the known producing area.
In this example, WEA was applied to a single 2D line as an early test of the technology in the area. The results of the WEA project indicated that the fault block where drilling was planned would be nonproductive at all objective horizons. Unfortunately, the well to test this fault block was drilled and as predicted by WEA it was dry at all three target horizons.
Fortunately, WEA identified several other good prospects in other locations which will likely be tested with future drilling. Fig. 26 illustrates the WEA result and the prospective locations identified by WEA.
Summary
The 2Q attenuation model splits the energy absorption phenomenon into two quasi-independent mechanisms: the energy loss due to the squirt flow of liquid, and the energy loss due to volume-variation of gas within the pore space.
We have proven that the spectrum of the traveling wavelet is sensitive to both of these mechanisms. The attenuation factor indicative of the liquid squirt flow is extracted from the wavelet spectrum between zero- and dominant-frequency, whereas the gas volume-variation attenuation factor is obtained from the wavelet spectrum between dominant- and Nyquist-frequency.
It is also shown that, using PID method, the mixed phase-lag nonstationary wavelet can be extracted from seismic data based only on the energy absorption properties of the substrate. In particular, the smoothness of the wavelet spectrum is proportional to the energy attenuation coefficient. No assumptions about randomness of the reflectivity function and the phase-lag of the wavelet are needed for this kind of wavelet extraction.
The spectral decomposition technique utilized by WEA method brings the time-frequency resolution to the maximum allowed by the digital seismic data. The attenuation analysis is conducted on the traveling wavelet extracted from the instantaneous spectrum. Physically this is a more sound approach then the attenuation analysis of the spectrum itself.
The velocity dispersion phenomenon may cause false WEA anomalies in the high-velocity region of the substrate and, for the same reason, the absence of true WEA anomalies in the low-velocity region. The compensation for damaging effect of the velocity dispersion on the spectrum of the traveling wavelet proved to be very effective in both the clastic and carbonate environments.
The commercial applications of the WEA indicate that the method is robust in clastics and shows promise in the carbonate environment.
The results of WEA processing are useful for both exploration and production drilling activities.
In terms of exploration applications, WEA delivers certain advantages over existing acoustic impedance contrast based methods, such as AVA and inversion. Since WEA measures the response to energy attenuation of a nonstationary traveling wavelet, it automatically adapts to varying lithological properties of earth.
Hence the WEA method is volume-oriented and, in a single processing run, produces a valid result for all different lithologies within a seismic volume. WEA does not require specifying a target zone in advance such as with AVO, and it also does not require any well log calibration points such as with inversion. Under most conditions, in a given volume of seismic data processed for a WEA result, a much greater percentage of exploration targets can be more efficiently identified than with existing methods.
Also, since WEA is not subject to the "dim-out-zone" effects and other limitations of direct detection methods described earlier, the WEA method can "see" reservoirs that amplitude-based methods such as bright spot analyses and AVA will be "blind" to. These new reservoirs, which can now be seen with WEA, become the new plays in the given exploration area.
Due to the nature of the methodology, WEA has extraordinary utility as an exploration tool to apply to either "rank wildcat" exploration areas, where well control is limited, or to data sets where all the other methods have been previously applied but where the existing methods missed many remaining exploration opportunities due to their inherent limitations.
When applied in a development and production drilling environment, WEA can assist the development geologist and engineer in determining whether additional missed reservoirs might be located "behind pipe," or if there might be additional development potential located below existing well control or located on the fringe areas of a known field beyond the limits of existing well control. F
References
1. Lichman, E., "Informational Capacity of Acoustic Measurements," Journal of Computational Acoustics, Vol. 9, No. 4, 2001, pp. 1,395-1,406.
2. Lichman, E., "Phase Inversion Deconvolution for Surface Consistent Processing and Multiple Attenuation," SEG 69th annual meeting expanded abstracts, 1999, pp. 1,299-1,302.
3. Pride, S.R., Harris, J.M., Johnson, D.L., Mateeva, L., Nihei, K.T., Nowack, R.L., Rector, J.W., Spetzler, H., Wu, R., Yamomoto, T., Berryman, J.G., and Fehler, M., "Permeability dependence of seismic amplitudes," The Leading Edge, Vol. 22, No. 6, 2003, pp. 518-525.
4. Matheney, M.P., and Nowack, R.L., "Seismic Attenuation Computed from GLIMPCE Reflection Data and Comparison with Refraction Results," Pure and Applied Geophysics, Abs. Vol. 153, Issue 2-4, 1998, pp. 539-561.
5. Roth, E.G., Wiens, D.A., and Zhao, D., "An empirical relationship between seismic attenuation and velocity anomalies in the upper mantle," AGU fall meeting, 1998.
6. Wiens, D.A., Roth, E.G., and Shore, P.J., "," Proc. of 1995 IUGG meeting, Boulder, Colo., B403, 1995.
7. David, M.F., and Yunbo Xie, "Recent approaches to the acoustic-seismic study of ice mechanics," ASA 126th meeting, Denver, Oct. 4-8, 1993.
8. Gurevich, B., Zurianov, V.B., and Lopatnikov, S.L., "Seismic attenuation in finely layered porous rocks: Effects on fluid flow scattering," Geophysics, Vol. 62, 1997, pp. 319-324.
9. Kondic´, L., Joel, I.G., and Chi Yuan, "Theoretical studies of sonoluminescence radiation: Radiative transfer and parametric dependence," Physical Review E, Vol. 52, No. 5, 1996, pp. 4,976-90.
10. Aki, K., and Richards, P.G., "Quantitative Seismology (Theory and Methods)," W.H. Freeman & Co., 1980.
11. Lichman, E., Peters, S.W., Wilson, P.H., Yuan MingShen, Liang ShiJun, Yan YuKui, Zhang You Jiang, and Wang YongHong, "Direct Gas Detection using Wavelet Energy Absorption," EAGE 65th conference & exhibition, Stavanger, Norway, 2003.
12. Peters, S.W., Lichman, E., and Wilson, P.H., "Gas Detection on Instantaneous Seismic Wavelets Applied in East China Sea," SEG 73rd annual meeting, Dallas, 2003.


