Optimized development increases mature Egyptian field recovery
Abdelnaser Hamdy
Khalda Petroleum Co.
Cairo
Sayed Gomaa
Al-Azhar University
Cairo
Mature Fields A and B in the western Egyptian desert produce dead oil from Upper Bahariya (UBAH) and Lower Bahariya (LBAH) reservoirs under depletion drive. They have 161 million bbl and 16 million bbl original oil in place (OOIP), respectively. Over the past 2 years oil production has flattened or decreased while water cut (WC) from water flooding for pressure support has increased. Water sweep efficiency is low due to heterogeneity in the reservoirs, and recovery factors (RF) are low.
To address rate decline, high WC, low RF, and pressure decline in both fields, a detailed reservoir management plan analyzed core, pressure, and production log data to optimize workovers, new wells, and injection schemes.
New vertical and horizontal drilling maximized hydrocarbon recovery by reducing large well spacing and irregular well distribution using optimized patterns for production and injection. Workovers shut off water in high-water producing wells, reopened shut in wells either to injection or production, stimulated reservoirs with hydraulic fracturing or acidizing, and converted some producers to injectors to overcome pressure depletion.
After implementing the program, production and recovery factors at both fields improved significantly.
Reservoir performance
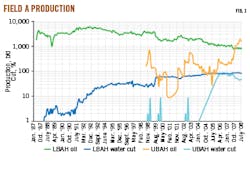
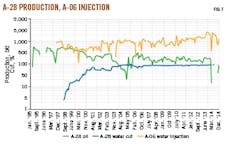
In Field A, LBAH WC has increased significantly in almost all wells. Some layers are completely swept while others have ineffectual flooding. Oil rate declined to 800 b/d from 6,000 b/d as WC increased to 86% (Fig. 1). RF is about 18%, which is less than optimum for water flooding in this area.
Field A UBAH started with two wells and showed poor performance but was further developed with 43 new drills. Twenty-five wells are producing from UBAH reservoir only (cased and perforated without stimulation) and 18 wells are commingled with LBAH reservoir. Twelve non-commingled UBAH wells show greater than 40,000-bbl estimated ultimate recovery (EUR), which is commercial because of low completion cost. The rest of UBAH completions are uneconomic with EUR less than 40,000 bbl. There is no field-wide trend for EUR/well.
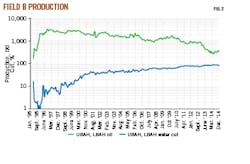
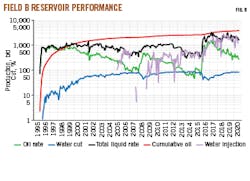
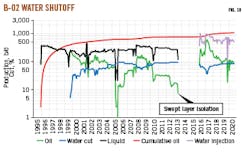
For Field B, wells produce from commingled UBAH and LBAH reservoirs and showed continuous oil rate decline accompanied by WC increase until production reached 300 b/d with 90% WC (Fig. 2). Production logging tools (PLT) revealed that most injected water went to UBAH because of good sand quality.2 UBAH was isolated after wells almost watered out. Producers and injectors in LBAH were stimulated to overcome damage occurring during commingled production.
Core data
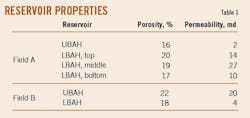
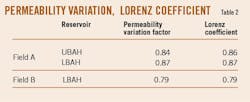
Core samples and analysis were available from six wells in Field A and three wells in Field B. Table 1 shows porosity and permeability ranges in UBAH and LBAH for both fields. Both reservoirs are characterized by high vertical heterogeneity, extending laterally and vertically. Lorenz and Dykstra-Parsons coefficients characterizing degrees of reservoir heterogeneity are shown in Table 2.1 Core analysis indicates LBAH in Field A has 33% irreducible water saturation and 19% residual oil saturation. Wettability measurements indicate that the formation is moderately-to-strongly oil wet.
Correlation, pressure data
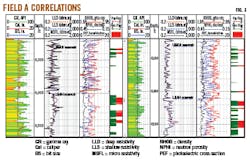
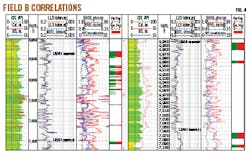
Well correlation and pressure data reveal reservoir heterogeneity and continuity. In some areas where correlations are vague and sands appear discontinuous, pressure uniformity suggests that the reservoir is continuous. LBAH in Field A consist of three layers with differing rock quality whereas UBAH consists of thin sand layers interbedded with shales, silt, and limestone (Fig. 3). UBAH in Field B consists of sandstone body that differs in rock quality and thickness from one location to another, while LBAH is silty sand with clear and significant differences in quality (Fig. 4).
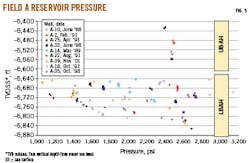
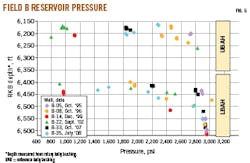
Reservoir pressure differences for UBAH and LBAH in Field A are either from reservoir discontinuity or differences in proportion of water entering discrete layers at injectors (Fig. 5). Reservoir pressure was on decline in upper LBAH of Field B, indicating lack of injection support for this layer. UBAH was on depletion before starting injection, and reservoir pressure increased after injection. Fig. 6 shows pressure data recorded in each well immediately after drilling (spud date shown in legend) and before running casing. After starting production from UBAH, pressure depletion was observed in B-08, B-14, and B-22. After starting injection in B-08, reservoir pressure increased in B-33 and B-35. Pump performance also improved in B-14 and B-22.
Shut-in wells
In both fields, many wells were shut in either from mechanical failure, formation damage, noncommercial production, or bad waterflooding management. For example, A-3 was producing 200 b/d from LBAH but was shut in due to mechanical problems, and A-26 was shut in due to depletion after only producing 10,000 bbl from UBAH. The forward reservoir management strategy required a consistent producer-injector count, and further shut ins had to be minimized.
Production logging
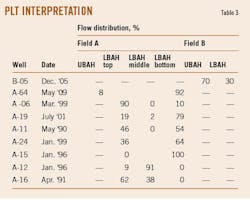
Interpretation of PLT’s is critical for determining bypassed oil in all zones as targets for workover or drilling operations. Table 3 summarizes PLT results for injectors in both fields.
In Field A, PLT in injector A-64 shows that UBAH is not supported like LBAH. For wells injecting into LBAH only, PLT shows different proportions of water entering each layer. In Field B, most injected water is primarily going to UBAH based on good rock quality compared with LBAH. This leads to bypassed oil in LBAH from insufficient sweep.
Production, injection review
In Field A, most UBAH wells had rapid production decline due to reservoir heterogeneity and inefficient injection and stimulation. LBAH wells were completed to commingle production across three layers, and all show pressure depletion. In 1989, water flooding in a peripheral injection pattern started to address production decline. The nearest producer wells to injectors (A-28 to A-06, respectively) showed good response (Fig. 7), and electric submersible pumps (ESPs) were upgraded in some wells. However, producers away from injectors showed continuous decline and eventual shut in despite injection, indicating that peripheral injection is not ideal in layered reservoirs. A 5-spot pattern is more suitable for heterogeneity in UBAH and LBAH.
In Field B, production was commingled from UBAH and LBAH despite clear differences in rock quality and high LBAH heterogeneity. Production initially declined from depletion but improved with injection (Fig. 8).
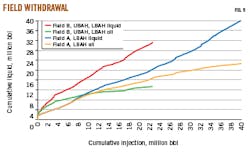
Fig. 9 shows reservoir withdrawal for both fields. Cumulative fluid slopes greater than unity indicate effective injection with dead oil in the reservoirs. Ineffective withdrawal from early water breakthrough shows in deviations of the oil curve from the total fluid curve at low cumulative production.
Result of the analysis showed that:
- Some wells were shut in due to down hole equipment problems.
- Some wells had low productivity and injectivity while others produced with high WC.
- Some layers suffered severe pressure depletion from bypassed injection due to low reservoir quality.
- Peripheral injection pattern was not suitable for heterogeneous reservoirs.
- RF factor was low for both reservoirs.
Workover program
The workover program isolated swept layers to prevent them from masking other layers. This isolation avoided unnecessary water circulation, reduced water load, and made additional pressure support available to other wells. Fig. 10 shows B-02 performance before and after swept-layer isolation. Oil production increased to 250 b/d from 30 b/d, and WC decreased to 30% from 90%.
A 5-spot pattern replaced peripheral injection by converting some producers to injectors. Wells shut in from depletion were reopened. For example, well A-32 was shut in but was able to reopen and produce 100 b/d. Existing-well production improved (A-63 increased to 400 b/d from 100 b/d), and reservoir sweep efficiency increased. Based on these changes, injection rate increased to 14,000 b/d from 6,000 b/d at Field A.
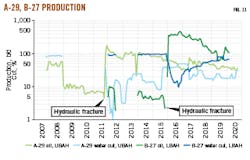
Hydraulic fracturing enhanced production from all UBAH wells in Field A. These wells were chosen due to the reservoir’s high heterogeneity. Fig. 11 illustrates the difference in well production before and after hydraulic fracturing for UBAH A-29 where oil increased to 130 b/d from 10 b/d. For LBAH B-27, oil increased to 350 b/d from 10 b/d.
Three injectors were acid stimulated in Field B to improve LBAH injectivity. The zone injectivity improved by a factor of three.
Drilling program
The drilling program included 48 new vertical wells and one new horizontal in Field A to address bypassed hydrocarbon and large well spacing. No new drilling was planned for Field B because wells were adequately spaced, and a workover program was sufficient to address bypassed hydrocarbon.
A horizontal well with multistage fractures addressed heterogeneous reservoir issues.3 4 For Field A UBAH, most uneconomic vertical wells were at reservoir edges where reservoir heterogeneity limited production. Horizontal drilling addressed this issue by linking discontinuous sand bodies and mitigating tightness issues with increased surface contact between producers and reservoirs in undeveloped areas.
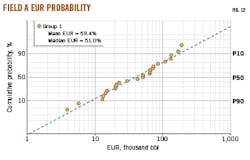
A horizontal well was drilled with 3,000-ft lateral and six stage hydraulic fractures to develop a total area of 114 acres. Petrophysical analysis of the drilled well showed 1,200-ft pay with 20% porosity and 36% water saturation. The well had initial production of 600 b/d compared with about 70 b/d for vertical wells. The well accumulated 210,000 bbl to date. By contrast, only 50,000-bbl mean (P50) EUR can be expected for a vertical well in this area based on a probability plot (Fig. 12). Table 4 compares horizontal and vertical well production and economics.
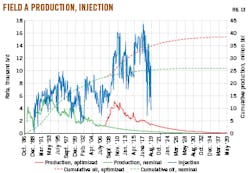
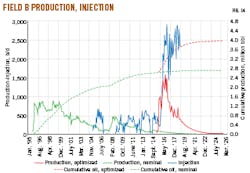
The new reservoir management program significantly increased oil rates and cumulative production at both fields over the previous (nominal) set of conditions (Fig. 13 and Fig. 14). Field A cumulative production increased to 35.4 million bbl from 25.3 million bbl, and Field B cumulative production increased to 3.8 million bbl from 2.6 million bbl (Table 5). Recovery factors also improved. RF in Field A and B LBAH increased to 29% from 22% and 40% from 27%, respectively. UBAH reservoir recovery factor in Field A improved to 14% from 4%.
References
- Jensen, J.L. and Currie, I.D., “A New Method for Estimating the Dykstra-Parsons Coefficient to Characterize Reservoir Heterogeneity,” SPE-17364-PA, SPE Reservoir Engineering, Vol. 5, No. 3, August 1990.
- Ouyang, L.B., “Field Case Histories Demonstrating Critical Role of PLT Flow Model Selection for Improved Water Shut-off Results in Offshore Thailand,” IPTC-12628-MS, International Petroleum Technology Conference, Kuala Lumpur, Malaysia, Dec. 3-5, 2008.
- Ratterman, E.E., Augustine, J.R., and Voll, B.A., “New Technology Applications to Increase Oil Recovery by Creating Uniform Flow Profiles in Horizontal Wells: Case Studies and Technology Overview,” IPTC-10177-MS, International Petroleum Technology Conference, Doha, Qatar, Nov. 21-23, 2005.
- Haiyang, Y., Zhewei, C., Zhonglin, Y., Shiqing, C., Youan, H., and Bo, X., “Allied In-Situ Injection and Production for Fractured Horizontal Wells to Increase Hydrocarbon Recovery in Tight Oil Reservoirs: A Case Study in Changqing Oilfield,” IPTC-19125-MS, International Petroleum Technology Conference, Beijing, China, Mar. 26-28, 2019.
The authors
Abdel-Nasser Hamdy Abdel-Moaty ([email protected]) serves as reservoir engineering assistant general manager at Khalda Petroleum Co. He holds a BS (2001) and MS (2017) in petroleum engineering from Al-Azhar University and is a PhD candidate at Suez University.