Global trends study foresees no short-term liquids output shortfall
Global users have consumed 45% of the oil and 30% of the gas discovered by the end of 2003, said IHS Energy, Epsom, UK, in releasing highlights of its 2004 report on world petroleum trends.
The world averaged 75.5 million b/d of liquids production, a new peak, in 2003, IHS estimated. That includes oil, condensate, natural gas liquids, oil sands, and Orimulsion production but excludes refinery processing gains. World gas production exceeded 100 tcf in 2003 for the first time.
A number of major production projects are still due to come onstream, suggesting no obvious shortfalls in oil production between now and 2008, said Ron Mobed, IHS president and chief operating officer.
"In terms of long-term remaining resources in the ground, we believe the global resource base for hydrocarbons is still healthy and will be aided by a growth in exploration investment that is now under way.
"Yes, an energy 'demand crunch' does exist at the moment, and certain factors, particularly of a geopolitical nature rather than geological, are contributing to that crunch and the resulting price ramp we've experienced in recent weeks," Mobed said in mid-October.
IHS said it expects an upturn in world strategic exploration investment. The report, oriented to the period 1994-2003, also draws conclusions about discoveries, drilling, licensing, and seismic acquisition.
Resources and output
The world liquids resource discovered through the end of 2003 was 2.285 trillion bbl, and cumulative production was 1.02 trillion bbl, IHS estimated.
The remaining liquids resource is 1.265 trillion bbl.
Additions in 1995-2003 from resource growth in pre-1995 discoveries plus 144 billion bbl of additions from new field and new pool discoveries far exceeded global liquids output for the same period.
The world gas resource discovered through the end of 2003 was 9,725 tcf, of which 2,910 tcf had been produced.
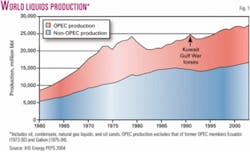
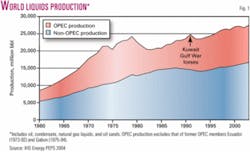
OPEC's share of world liquids production was 39.5% in 2003, higher than in 2002 but lower than 1993-2001 (Fig. 1).
"There is a clear reason why oil production has not yet peaked and global depletion has not yet kicked in," IHS said.
"Up to the end of the 1970s (with the exception of the postwar boom in the early 1950s), and industry discovered more resources than it brought on stream. Not only did the industry discover more, but up to and including the early 1970s it tended to discover substantially more than the cumulative resources of the fields that were brought into production during each period.
"In other words, the gap between discovered resources and developed resources widened in absolute terms, reaching a peak of 860 billion boe of undeveloped resources by 1980." The gap widened in percentage terms between 1950 and 1975 (Table 1).
Also contributing to the climb in production were development of prior discoveries that became available due to political change, unconventional heavy oil projects in Canada and Venezuela, and gas related liquids.
Regional trends
Regional production gains in 2003 came in the former Soviet Union 13%, Saharan Africa 8%, and Middle East 7.7%. North American production was up slightly, with natural field declines being offset by a 140,000 b/d increase in Canadian oil sands output.
Nonconventional liquids production from the Canadian oil sands and Venezuela's Orinoco is estimated to have grown by 11% in 2003 to 1.28 million b/d, representing 1.7% of world production.
Gas production, up 3.4% on the year, grew in all regions except North America, where output fell 0.2%. Qatar and Saudi Arabia contributed significantly to a 13.8% increase in gas production from the Middle East.
Former Soviet Union gas production, stable for a decade, is likely to rise as new pipelines are built in the Caspian region and LNG schemes for Sakhalin and possibly the Arctic are developed.
Norway's Ormen Lange supergiant gas field and Snohvit LNG development starting in 2007-08 will offset a European gas production decline that began in 2003.
Discovery patterns
Resource additions in new field discoveries totaled 13.9 billion bbl of liquids and 68 tcf of gas in 2003.
Operators reported 46 discoveries of 100 million boe or greater in 2003, five more than in 2002. The largest was Iran's giant Lavan gas-condensate find of 6 tcf in a Paleozoic reservoir beneath Lavan Island, the year's only billion-barrel find.
Eight other finds of more than 500 million boe came in, three in Brazil and one each in Angola, China, Malaysia, Sudan, and Viet Nam. Those in China and Viet Nam were gas-condensate finds, and the rest were oil dominant.
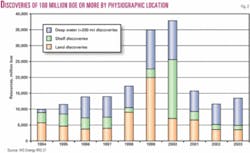
Seventy percent of 2003's major discoveries were in more than 200 m of water, and 65% were in more than 1,000 m of water (Fig. 2). Overall, 64% of the 100 million boe-plus resources discovered were in deep water.
Discoveries of 100 million boe or more came in 51 countries. Seven countries—Angola, Kazakhstan, Iran, Brazil, Nigeria, the US, and Saudi Arabia (in descending order of liquid volume discovered)—had discoveries of more than 5 billion bbl of liquids.
Gas resources of more than 5 billion bbl of oil equivalent each were found in seven countries—China, Iran, Australia, Indonesia, Norway, Bolivia, and Egypt (in descending order of gas volume discovered). Only in Iran were resource additions in excess of 5 billion boe made for both liquids and gas.
Drilling highlights
The report identifies a link between higher oil prices and increased exploration activity with a time delay of 12 months.
Exploration spending rose in 1994-2003, but as a proportion of total E&D spending excluding property acquisitions it fell from 26.8% of all E&D spending in 1998 to 18.7% in 2003. Exploration spending outside North America fell to 58.5% in 2003 from 66% in 1998.
In 2003, 1,130 new field wildcat wells were completed outside North America, a 10% increase from 2002's depressed level and slightly above the average for 1994-2003. North American new field wildcat drilling rose 6% to 1,584 wells but remained 8% below the decade's average.
Analysis of company activity indicated that new field wildcat drilling by the large international players, in particular those major companies that participated in mergers in 1999-2000, declined sharply from 2000 onward.


