MODELING GULF OF MEXICO LOST PRODUCTION—2: Model framework can aid decision on redevelopment
Most of the destroyed infrastructure from the 2004 and 2005 hurricane seasons in the Gulf of Mexico were mature assets low on their production curve. The revenue stream from a destroyed asset is at the least deferred, and unless the field is redeveloped, previously economic reserves will be left in the ground.
Property owners of destroyed assets are faced with a decision: Should the asset be abandoned along with its future cash flow or should the asset be redeveloped? Mature assets are unlikely to meet the economic thresholds to support redevelopment, and in the majority of cases, these structures will be abandoned by owners.
In Part 2 of this four-part series, we develop a model framework to forecast the production and revenue streams associated with the collection of destroyed assets. The general framework of analysis is outlined along with the assumptions employed in modeling.
Model framework
To estimate the amount and value of production that a structure would have generated if it was not destroyed, a five-step procedure is applied:
Step 1. Model the structure’s historic oil and gas production data.
Step 2. Forecast future production based on model curves assuming stable reservoir and investment conditions.
Step 3. Forecast future revenue based on a given hydrocarbon price deck.
Step 4. Terminate production when revenue from the structure falls below its estimated cost of operation.
Step 5. Output cumulative production and present value of the revenue stream.
STEP 1: Model production profiles
Notation
Structure s is the basic unit of analysis. Define qti (s) as the amount of hydrocarbon type i (i = oil, gas, BOE) produced by structure s in year t. Oil production is expressed in barrels (bbl) and includes condensate (natural gas liquids); gas production is expressed in thousand cubic feet (Mcf) and includes associated gas (oil well gas, or casinghead gas). The production stream for an asset is described by its oil, gas, and BOE vectors, denoted as: qo(s) = (q1o, q2o, ...), qg(s) = (q1g, q2g, ...), and qBOE (s) = (q1BOE, q2BOE, ...) where the ith element of each vector denotes the ith year of production.
Decline curves
Production levels exhibit a wide variety of shapes due to factors and events that are unobservable, unpredictable, or both, related to reservoir characteristics, aggregation levels, investment strategies, weather events, technical intervention, and various other conditions.
Multiple production peaks after plateau are common. Preplateau peaks may also occur if development occurred in stages or unforeseen events arose during development. The purpose of decline curves is to characterize production outside the influence of exogenous factors.
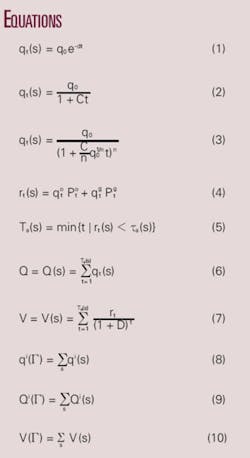
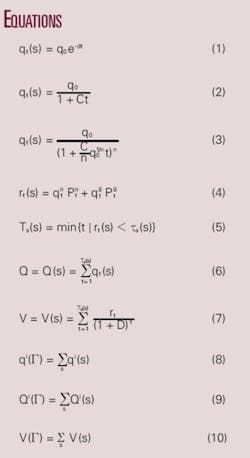
Three types of decline curves are commonly used in reservoir engineering to describe the production of a well or group of wells after plateau: exponential declineshown in Equation 1, hyperbolic decline, given by Equation 2; and harmonic decline, shown in Equation 3. In Equations 1-3, qt(s) denotes the production rate of structure s in year t, qo represents the initial (or peak) production rate, and d, C, and n are parameters determined from historical data.
The exponential model is probably the most frequently used method to model production profiles because of its ease of application and ability to capture basic reservoir dynamics. Hyperbolic decline models the production drop as a fractional power of the production rate and is usually applied during the later stages of the life cycle of a well. Harmonic decline is often used to model gravity drainage or water drive mechanisms. For some fields, the production rate may not be adequately modeled using any of these function types.
Structure classification
For each structure, we fit each fluid stream (oil, gas) to each of the three model forms (exponential, harmonic, hyperbolic) using regression techniques and select the best-fit curve using the maximum R2-value. The input to the procedure is the structure’s historic production of oil and gas, and the output is the model parameters for the best-fit decline curve for each hydrocarbon stream. If the model fit for qti(s) has an R2-value that exceeds 0.75, the model is considered an acceptable fit and a reasonable predictor of future production. We refer to structures that satisfy this criterion as “normal” producers.
A small number of structures have production profiles that do not yield an acceptable bestfit curve. If R2 <0.75 for the oil or gas stream, the model fit is deemed unacceptable and simplified techniques are applied to generate the forecast curve. In this case, we repeat the curve fitting procedure from the second-half of the production profile.
In other words, if a structure is T years old at the time of observation, then we model the second-half of the production history, using data beginning in year T/2. If the reduced time horizon model does not satisfy R2 >0.75, then we assume an exponential model based on the structure’s historic decline rate. Structure profiles with initial R2 <0.75 are referred to as “chaotic” producers.
Structures that are early in their life cycle present a special problem, since production has probably not peaked and remains largely unknown. Forecasting lost production from early producers, say within 7 years of first production, are subject to a large amount of uncertainty.
For this subset of producers, we make a conservative estimate that production has peaked over the time horizon observed and declines following the exponential model according to a specified decline rate that is held fixed across time. Structures that are within 7 years of first production are classified as “young” producers.
“Idle” structures refer to structures that were not producing at the time of their destruction. Idle structures are unlikely to restart production or to be redeveloped at a later time. We consider any structure inactive prior to 2003 incapable of future production. Nearly a quarter of the hurricane-destroyed structures was idle in 2003.
“Uneconomic” structures are producing structures with revenue streams in 2006 that have already fallen below their estimated economic threshold. When the revenue stream generated by production falls below a structure’s economic threshold, the operator will stop producing.
About 20% of the active structure set was uneconomic in 2006.
STEP 2: Forecast future production
The model curves determined in Step 1 are used to forecast future oil and gas production for the three classes of assets identified:
- Normal producers: structures that yield best-fit oil and gas production profiles with R2 ≥0.75.
- Chaotic producers: structures that have initial best-fit production profiles with R2 <0.75.
- Young producers: structures with less than 7 years production history.
Structures that do not exhibit a reasonable model fit or are early in their life cycle are subject to a greater amount of forecasting uncertainty. These subsets of structures are therefore considered separately. For all three asset classes, the production curves qi(s) determined in Step 1 are used as the forecast model. Time is initialized to the year 2006 (t = 1), and for the model form and decline curve parameters determined, we step ahead year-by-year in the production forecast, yielding qi(s) = (q1i, q2i, …).
The forecast is performed under the assumption of “stable reservoir and investment conditions.” This is a very strong assumption and one that is frequently invoked without due caution to its impact on model results. A structure that was producing prior to the appearance of a hurricane is assumed to produce according to its historic rates after the event. We assume that the modeled production will not be altered in the future due to reservoir/production problems or additional investment (to enhance production, recover additional reserves, etc.). We control for the impact of the stability assumption on our model results by performing sensitivity analysis.
STEP 3: Forecast future revenue
Revenue is estimated by multiplying the oil and gas production forecast by the average market hub prices in the year received.
The hydrocarbon quality (API gravity, sulfur content, etc.) and transportation expense to deliver production to market is not considered. Company oil and gas sales are primarily made in the spot market or pursuant to contracts based on spot market prices. In an attempt to reduce price risk, a company may enter into hedging transactions with respect to a portion of future production. The impact of hedging or other price risk management strategies that the owner may have employed are not considered.
Revenue in year t for structure s is computed as shown in Equation 4, where Pto and Ptg represent the average oil and gas price in year t, respectively. We assume a price deck that is constant throughout the life cycle of the structure: Pto = Po and Ptg = Pg.
The revenue forecast vector starts in the year 2006 and is denoted as: r(s) = (r1, r2, r3, ...). Five commodity price scenarios are employed: P(I) = {Po = $40/bbl, Pg = $4/Mcf}; P(II) = {Po = $60/bbl, Pg = $6/Mcf}; P(III) = {Po = $80/bbl, Pg = $8/Mcf}; P(IV) = {Po = $100/bbl, Pg = $10/Mcf}; and P(V) = {Po = $120/bbl, Pg = $12/Mcf}. For each scenario, the oil and gas price is assumed constant over the life cycle of the structure.
STEP 4: Estimate abandonment time
When the production revenue generated by the asset falls below its current costs, the asset is considered uneconomic and production at the structure will cease (see sidebar). The time at which a structure is no longer commercial is determined by comparing the revenue in year t, rt(s), to the economic limit of the structure, τa(s), yielding Ta(s) as shown in Equation 5.
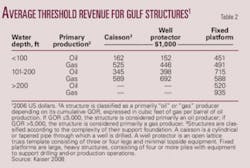
The value of the revenue threshold τa(s) is derived from empirical relations using historical data and is correlated with structure characteristics such as development type (caisson, well protector, fixed platform), primary production (oil, gas), and site characteristics (water depth).
The values of the economic limit represent category averages based on statistical analysis of over 1,500 structures removed in the Gulf of Mexico over the past two decades.3 Ta(s) determines the timefor a given production forecast, price deck, and revenue thresholdthat a structure will no longer be commercial (economic). At t = Ta(s), a rational operator will stop producing, which will terminate the cash flow vector: r(s) = (r1, r2, ..., rTa(s)).
STEP 5: Cumulative production and discounted cash flow
The cumulative production Q(s) and discounted cash flow V(s) associated with each structure is computed from 2006 (t = 1) through the time of abandonment (t = Ta(s)) as shown by Equations 6 and 7. In the valuation estimate, D denotes an industry-wide discount rate employed for each structure.
The choice of D has a significant impact on the value of lost production and the redevelopment decisions of operators. Each company uses its own rate to guide decisions, which may be the cost of capital, the borrowed cost of money plus the cost of dividends, the return from the least profitable investment, etc. For our purposes, since we are evaluating the aggregate value of lost production, a common discount rate is applied.
Aggregation
The final step is to aggregate the production profiles and discounted cash flow across all structures in the sample set. The model output for structure s is the forecast production profile, qi(s), cumulative production, Qi(s), and discounted cash flow, V(s). If the set of hurricane-destroyed structures is denoted Γ, aggregating across this collection yields Equations 8-10.
The cumulative oil and gas production, Qo(Γ) and Qg(Γ), and the value of production, V(Γ), represent the primary model output.
Descriptive statistics
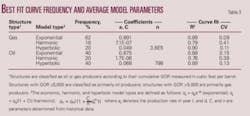
Three decline models were fit to each structure’s oil and gas production profile and the best-fit model parameters are shown in Table 3 in terms of structure type, model function, and frequency of occurrence. The average value of the model coefficients, average model fit, and coefficient of variation are also depicted. All producing structures were modeled, including idle and uneconomic producers. The exponential decline was the most frequently applied model specification.
The number of model curves classified as idle, uneconomic, normal, young, and chaotic are shown in Table 4. Idle and uneconomic structures form the largest subset of the collection. Nearly half the destroyed structures were no longer producing or were producing at levels below their economic limit in 2006. Of the remaining structures, 39 of the 67 producers yielded reasonable model fits; 19 producers were classified as young producers; and 9 did not yield an acceptable best-fit curve.
Next week: The model’s estimate of the value of production lost in the 2004-05 hurricane seasons.
References
- Harrel, R., and Cronquist, C. ,“Estimation of Primary Reserves of Crude Oil, Natural Gas and Condensate,” Ch. 16, pp. 1480-1570, in Reservoir Engineering and Petrophysics, Vol. V(B), E. Holstein, ed., SPE, Richardson, Tex., 2007.
- Energy Information Administration, “Oil and gas lease equipment and operating costs 1988 through 2006,” Washington, DC, June 2007. Also available: http://www.eia.doe.gov/oil_gas/natural_gas/data_publications/cost_indices/c_i.html.
- Kaiser, M.J., “Economic Limit of Offshore Structures in the GOMDescriptive Statistics,” Energy Sources B, Vol. 3, Part 2, pp. 213-224, 2008.
Economic limit and estimation techniques
When marginal costs exceed marginal revenues and the net cash flow for a structure is negative, the operator is unlikely to continue production. Operations may be shut down temporarily or permanently, depending upon the producing status of the lease, whether oil or gas is being produced, etc.
Economic limit
The economic limit is defined as the time when the direct operating cost of the structure is equal to the income under production.1
The economic limit criterion is reasonable given profit-maximizing decision makers. In practice, an operator may shut-in wells before the economic limit is reached if the return on the investment does not satisfy a given threshold or the operator decides for strategic reasons to exit the region. An operator may also produce for a period of time after the economic limit is reached if it intends to perform additional drilling on the property, can postpone maintenance and workover requirements, or believes prices will increase to return the operations to profitability.
Because many structures in the Gulf of Mexico are operated in aggregate units (clusters) either on a field or lease basis, the cash flow position of an individual structure is often reviewed in terms of its incremental impact to the overhead position of the production unit. An operator may continue to produce at marginal levels at a loss simply to delay the cost of abandonment. The decision criteria an operator employs for a specific asset are ultimately unobservable to analysts outside the company, but this does not negate the use of the economic limit as a proxy for these criteria.
Estimation techniques
The economic limit of a structure can be estimated based on its operating cost or by using historical data to assess the revenue position of structures at the time they stopped producing.
Both approaches have advantages and disadvantages. With expert opinion, estimates can be performed quickly and updated relatively easily. The main advantage of historic data is that we are measuring actual outcomes that incorporate a broad set of random events. Ultimately, the two approaches are roughly similar in their level of uncertainty.
Expert opinion
The EIA provides oil and gas lease equipment and operating costs on an annual basis for domestic oil and gas production operations.2 EIA personnel track equipment, labor, and maintenance cost, and categorize operating costs on a location and production basis. For the gulf, operating costs are estimated for 12 and 18-well slot platforms with dual completions assumed to be 50, 100, and 125 miles from shore (corresponding to water depths of 100, 300, and 600 ft, respectively). Maximum crude oil production is assumed to total 11,000 b/d and maximum associated gas production is assumed to be 40 MMcfd. Meals, maintenance, helicopter and boat transportation, communication, insurance, and administration are included in expenses; water disposal costs are not included. Table 1 provides operating cost estimates for offshore wells displayed by platform size and water depth. On a per-well basis, operating costs range from $621,000/well to $802,000/well.
Historical data
In the threshold level approach, the revenue of structures at the time of their abandonment is quantified relative to a set of attributes. Structures are grouped according to type (caisson, well protector, fixed platform), primary production (oil, gas), and site characteristics (water depth). Inflation-adjusted averages are computed across each categorization based on structure removals in the gulf over the past two decades.3 We associate the economic limit of a producing structure with its category average (Table 2).
Caissons and well protectors generally support three wells or less, while fixed platforms support several wells throughout their lifetime. Near abandonment, most structures will be producing from a small set of wells. When normalized on a per well basis, there is general agreement between the expert opinion values in Table 1 and the historic data presented in Table 2.


