SPECIAL REPORT: OGJ200 earnings mixed as US production, reserves climb
The OGJ200 group of companies recorded a decline in earnings last year as greater expenses ate into returns. The collective 2.5% dip in net income accompanied a 7% swell in revenues.
High costs for labor, equipment, and supplies underpinned the group’s capital and exploration spending, and the number of wells drilled climbed.
The group’s natural gas production and reserves moved higher from a year earlier, but liquids production and reserves totals were mixed.
There are 147 companies that qualified for this edition of the OGJ200. Last year, the number rose to 144 from an all-time low of 138.
OGJ began publishing this compilation in 1983 as the OGJ400, featuring the top 400 US-based, publicly traded oil and gas producing firms.
The total assets of the firms at the end of 2007 were $1.06 trillion, and their combined stockholders’ equity was $487.8 billion. Capital and exploratory expenditures totaled $126 billion, up 11% from the group’s 2006 outlays. US net wells drilled climbed 5%.
Changes to the group
Some of the companies in the group are new to the list, and some have changed their names since the previous edition of the OGJ200. Some no longer appear after being acquired or because of other reasons.
Based in South Lake, Tex., Harken Energy Corp. changed its name and now appears in the compilation as HKN Inc. Meanwhile, San Antonio-based Exploration Co. changed its name to TXCO Resources Inc. Panhandle Oil & Gas Inc., meanwhile, previously was listed as Panhandle Royalty Co.
Two of the firms that appeared last year were acquired by other companies and are no longer listed separately. These are Houston Exploration Co., which Forest Oil Corp. acquired, and Pogo Producing Co., which was acquired by Plains Exploration & Production Co.
Dominion Exploration & Production was reorganized by its parent company and is now listed as Dominion Energy Inc.
Five companies that were previously included in the OGJ200 no longer appear because they sold their producing properties in the US, liquidated their assets, or were bought by entities based outside the US. These include Challenger Minerals Inc., Hallador Petroleum Co., Peoples Energy Production, Toreador Resources Corp., and United Heritage Corp.
The 2007 results of two of the companies that qualify for the compilation were not available at presstime, so those companies’ results are excluded from group totals. These companies are Ness Energy International Inc. and PRB Energy Inc.
Thirteen companies appear in the OGJ200 for the first time. The highest-ranking of these, Exco Resources Inc., sits at No. 21 by yearend-2007 assets. Exco, with headquarters in Dallas, became publicly traded with an initial public offering in 2006.
There are five royalty trusts in the compilation, down from six in the previous OGJ200. There are also five subsidiaries, including Dominion Energy Inc., Seneca Resources Corp., Fidelity Exploration & Production Co., Equitable Supply, and DTE Gas & Oil Co.
Annual results
As the capital spending and drilling efforts of the OGJ200 companies increased last year, their production and reserves totals mostly moved upward.
The combined capital and exploration expenditures of the group increased 11% to $126 billion. Up 5% from 2006, the number of US net wells drilled by the group totaled 23,065.
The number of active rigs in the US climbed 7% last year, according to Baker Hughes Inc. At the same time, the rig count in Canada increased 12%, and the worldwide number of active rigs grew 4%, according to American Petroleum Institute.
Capital outlays varied widely among the companies in the survey. Such spending during 2007 by top-ranked ExxonMobil Corp. was up 5% from a year earlier, but No. 2 ConocoPhillips posted a 24% decline in capital spending. Meanwhile, No. 3 Chevron Corp. reported that its capital spending program last year increased 21%.
As reported a year ago, the previous OGJ200 group’s total spending surged 40% from 2005, and their net wells drilled in the US increased 27%.
The OGJ200 shows each company’s worldwide liquids and natural gas production and reserves and breaks out the results for the US. The group’s US liquids and gas reserves and their worldwide gas reserves totals were up from a year earlier, but their combined worldwide liquids reserves slumped 4%.
The group’s combined worldwide liquids production declined last year almost 1%, but their collective worldwide natural gas production climbed 3%. Meanwhile, the group’s liquids production in the US increased 3.5%, and US gas production grew almost 10% from a year earlier.
Financial performance
The OGJ200 group recorded improved combined financial results in each category except earnings. The companies’ yearend 2007 assets and stockholders’ equity both increased 14% from a year earlier.
The combined revenues of the OGJ200 companies climbed 7% from 2006, but their net income declined 2.5%, partly dragged lower by the high cost of labor, supplies, services, and equipment.
Fifty of the companies in the OGJ200 group recorded positive but reduced earnings for 2007 compared to 2006. Meanwhile, 46 of the firms posted a net loss for 2007.
Strong oil price realizations pushed the group’s 2007 revenues to $1.06 trillion, but gas prices on average were unchanged from a year earlier.
Last year, the average US wellhead price of crude was $66.52/bbl, up from the 2006 average price of $59.69/bbl. Last year’s average US wellhead price of gas, meanwhile, was $6.39/Mcf, vs. $6.40/Mcf a year earlier.
Refining margins were relatively strong last year but were mixed in comparison to their 2006 averages. The relative strength of these cash refining margins helped increase earnings for the integrated companies in the OGJ200 during both 2006 and 2007. These gains, however, were tempered by a higher average refiners’ acquisition cost of crude.
The US Midwest cash refining margin last year climbed 23% to average $18.75/bbl, according to Muse, Stancil & Co. Over the same period, the margin on the West Coast declined almost 13% to average $20.96/bbl last year.
The composite US refiners’ acquisition cost of crude during 2007 averaged $67.93/bbl, up from $60.24/bbl a year earlier.
ConocoPhillips reported a decline in 2007 net income to $11.9 billion, including a second-quarter, after-tax impairment of $4.5 billion related to the expropriation of the company’s Venezuelan oil projects. For 2006, net income was $15.55 billion.
ConocoPhillips’ revenues were up from 2006, and its refining and marketing earnings for 2007 were $5.9 billion, up from $4.5 billion a year earlier.
No. 11 El Paso Corp. posted a 134% jump in earnings for 2007 to $1.11 billion. In February 2007, the company closed the sale of its ANR Pipeline Co. and other assets. The company’s operating revenue was up 9% year-on-year.
Fast growers
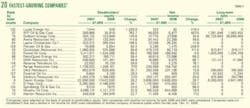
Lucas Energy Inc. is the fastest growing company in this edition of the OGJ200. With headquarters in Houston, Lucas Energy is ranked by assets at No. 132 and reported stockholders’ equity of $7.4 million last year. Earnings climbed to $322,000 from $62,000 in 2006.
The list of fastest-growing companies ranks firms based on growth in stockholders’ equity. For a company to appear on this list, it must have posted positive net income in both 2007 and 2006, and it must have had an increase in net income last year. Excluded from this list are limited partnerships, newly public companies, and subsidiaries. The list is limited to the top 20 fast growers.
ATP Oil & Gas Corp. is the second-fastest growing company in the list, posting a 763% boost in stockholders’ equity last year. Gulfport Energy Corp., Arena Resources Inc., and Layne Christensen Co. complete the top 5 fastest growing firms.
The highest-ranking company by assets on the list of fast growers is Devon Energy Corp. Devon Energy is the sixteenth-fastest growing company in the OGJ200 and ranks No. 6 in terms of assets.
Six of the current fast growers were also on the list in the previous edition of the OGJ200, which was based on 2006 results (OGJ, Sept. 17, 2007, p. 20). These are Gulfport Energy, Arena Resources, Quicksilver Resources Inc., GMX Resources Inc., Range Resources Corp., and Denbury Resources Inc.
Top 20 companies
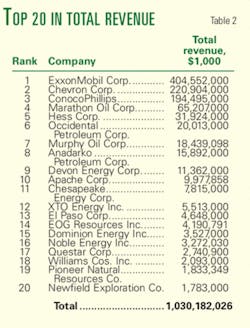
The 20 highest-ranking companies in terms of yearend-2007 assets posted results rather similar to the entire group. This subset of firms steers the list, having recorded 97% of the entire group’s revenues for the year.
The top 20 companies also accounted for 89% of the entire group’s assets and 93% of the OGJ200 group’s worldwide liquids reserves. The 2007 net income of the top 20 firms declined 1.7% to a combined $101.7 billion on revenues of $1.03 trillion.
Pogo Producing is the only company that previously ranked among the top 20 companies—at No. 19—but no longer is there, having been acquired during 2007.
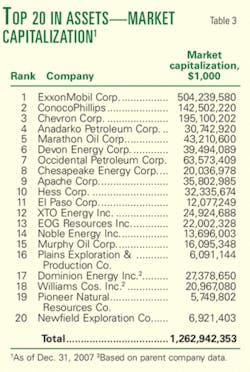
The one company that was able to join the top 20 in this edition of the OGJ200 is Plains E&P, which moved to No. 16 from No. 30 a year ago.
The market capitalization of this group of 20 firms as of Dec. 31, 2007, was $1.26 trillion. This is 25% higher than the market cap of the top 20 in the previous OGJ200.
Earnings leaders
The OGJ200 also ranks the companies by factors other than total assets, with top 20 rankings by earnings, revenues, capital spending, production, and other gauges.
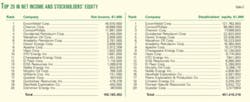
With record 2007 net income of $40.6 billion, ExxonMobil by far led the OGJ200 group in earnings, followed by Chevron with $18.7 billion in net income. Occidental Petroleum Corp. reported $5.4 billion in net income for the year.
Some of the companies in the top 20 by net income list are not ranked in the top 20 by assets. These include Questar Corp., with earnings of $507 million. Based on its assets Questar is ranked at No. 22 overall, but reported the seventeenth-highest earnings.
No. 33 by assets, Quicksilver Resources Inc. is the eighteenth company among the earnings leaders, with record net income of $479.4 million for the year. The company reported higher production volumes, higher sales prices for oil and gas, and higher production costs from 2006.
Capex, drilling leaders
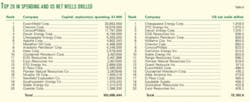
Leading the OGJ200 companies in 2007 capital and exploratory expenditures are ExxonMobil, Chevron, ConocoPhillips, Devon Energy, and Chesapeake Energy Corp.
Chesapeake Energy reported such spending of $5.3 billion and leads the group in the number of net wells drilled in the US for 2007. The Oklahoma City-based producer last year drilled 1,919 net wells in the US, focusing on onshore gas east of the Rocky Mountains.
The second-leading OGJ200 company in terms of 2007 drilling is XTO Energy Inc, with 1,073 net wells drilled in the US, followed by Devon Energy with 1,015 US net wells drilled.
Top 20 in reserves, production
The top three companies by assets—ExxonMobil, ConocoPhillips, and Chevron—also appear at the top of the rankings by US liquids production, worldwide liquids production, worldwide gas production, worldwide liquids reserves, and worldwide gas reserves, but not necessarily in the same order.
With 168 million bbl of output, Chevron leads the OGJ200 companies in terms of US liquids production. ExxonMobil tops the list of 2007 worldwide liquids production leaders with a total of 801 million bbl.
Kinder Morgan CO2 Co. LP ranks at No. 43 in the OGJ200 by assets, but is thirteenth on the list of top 20 companies in terms of US liquids production and sixteenth in terms of worldwide liquids production. During 2007, Kinder Morgan CO2 produced 15 million bbl of liquids, all in the US.
Regarding US gas, ConocoPhillips led producers with 948 bcf of US output last year. Meanwhile, ExxonMobil posted the most worldwide gas production among the OGJ200 companies with 2.683 tcf of output for the year.
ConocoPhillips also holds the most liquids reserves in the US. But ExxonMobil holds the most worldwide liquids reserves as well as the most gas reserves in the US and worldwide.


