ML, hybrid risk models predict stuck pipe
Abraham C. Montes
Pradeepkumar Ashok
Eric van Oort
The University of Texas
Austin, Tex.
Alex Procyk
Upstream Editor
Oil & Gas Journal
Drilling incident predictors (DIP) anticipate drilling incidents which can lead to non-productive time. Researchers at the University of Texas at Austin produced data-driven and hybrid data-physics based DIP models to analyze stuck pipe incidents at the Frontier Observatory for Research in Geothermal Energy (FORGE) sponsored by the Department of Energy in Milford, Utah.
Three machine learning (ML) models incorporated either exclusively measurement-based analysis or a hybrid measurement analysis coupled with results from physics-based simulations. The former is limited to surface and downhole sensors and includes hook load (HKL), standpipe pressure, mud density, and well inclination. The latter adds interpreted drilling conditions including cuttings transport, torque and drag, and wellbore stability. The hybrid model runs comparisons between data-derived forecasts and model-derived forecasts and assigns relative weights to their respective predictions based on comparison to training datasets or other criteria.
Overall, a hybrid fuzzy logic-physics based DIP model anticipated stuck pipe events in four Utah FORGE wells with 88% true and 12% false warnings. These early alerts would have provided rig crews time to take preventative actions against the stuck-pipe conditions in these wells.
ML, hybrid models
ML models consume real-time drilling data and predict drilling performance based on data analysis. UT researchers included the following ML approaches for their DIP models:
- Recurrent neural network (RNN).
- Autoencoder.
- Fuzzy clustering.
Fig. 1 illustrates semi-supervised RNN and autoencoder neural network data-driven models for DIP. RNN produces time-based forecasts and the autoencoder reproduces drilling input variables. Model results are compared with real-time drilling signals and are based on a prefiltered training dataset with all drilling anomalies removed (essentially training the models on what always should happen).
Autoencoders analyze reconstruction errors based on unsupervised training. Autoencoders autonomously discover patterns in training data and reduce the number of critical features for accurate prediction to a minimum (semi-supervised), rather than learning from known patterns in training data (supervised). Autoencoders learn a compressed, encoded representation of normal, trouble-free drilling signals. Once trained, the model decodes the representation during real-time drilling to replicate the inputs. If the inputs to the model contain anomalies (a drilling problem is occurring), then the autoencoder cannot replicate them and will produce an erroneous replication. This error in replication becomes a proxy for the sticking risk, with higher replication errors indicating higher sticking risk.
Fully unsupervised fuzzy clustering (Fuzzy C-Means) ranks the drilling risks of the real-time drilling data from the model by grouping datapoints (signals) into clusters based on similarities. The model is built on clearly identified patterns (clusters) in the data which are associated with different points in time. Similar data points closest to the sticking incident are grouped into the “high risk” cluster. Likewise, the oldest data points (those most distant from the sticking incident) which are similar are grouped into a “low risk” cluster.
Six models were constructed which included three purely data-driven models and three hybrid models. The hybrid models contain two types, one based on Fuzzy C-Means and two based on data-driven models. For the fuzzy-clustering hybrid model, the output of the underlying physics-based models provides new features which feed the clustering model. Datapoints falling in the high-risk cluster grouping bolsters the likelihood of a drilling incident.
The data-driven hybrid models combine outputs from data-driven and physical models into a probability mixture. Data-driven model discrepancies and physics-based model deviation from normal drilling conditions flag drilling anomalies which could lead to an incident. Table 1 lists model types and features.
DIP
Results from both data-driven and hybrid approaches create drilling warnings if forecasted outputs deviate above a set threshold from real-time drilling data within a sliding time window (Fig. 2). The sliding window minimizes effects of short-term fluctuations in the drilling or simulated (drilling proxy) variable which would otherwise cause a premature and inaccurate drilling warning. The sliding-window time width can be varied as more historical site-specific drilling data becomes available.
Threshold variations result in a set of receiver operating characteristic (ROC) curves which delineate drilling risk in terms of severity and type based on the relationship between true positives and false positive predictions. The former indicates the model's tendency to accurately anticipate risky conditions, and the latter indicates the model’s tendency to miss upcoming negative drilling events. While false positives are better than false negatives from a drilling risk and lost time perspective, excessive false positives lead to model discreditation, and ultimately either disuse or dismissal. Model effectiveness is based on the area under the ROC curve, with greater area indicating better performance.
Utah FORGE application
FORGE provided negative drilling-event data to evaluate ML and hybrid models. The reservoir at FORGE consists of an intrusive igneous formation that ranges from granite to diorite, occasionally exhibiting metamorphism (gneiss). Of the first five deep wells (>3,500 ft) drilled, three were vertical and two contained build-and-hold profiles.
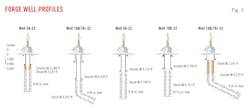
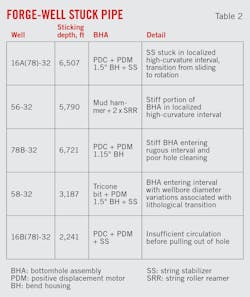
All five wells were drilled beyond 7,500-ft MD, and all experienced stuck pipe events (Fig. 3). Two incidents occurred while drilling and three while tripping. Pipe sticking mechanism varied among the wells and included undulations and diameter variations (16A(78)-32, 56-32, 58-32, 16(B)-32) and tortuosity and poor hole cleaning (78B-32, 16(B)-32) (Table 2).
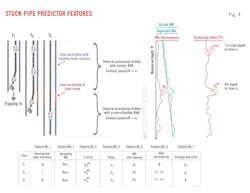
Detailed analysis of the data revealed four main variables required for predictive models to anticipate stuck pipe:
- Relative position of BHA contact points with respect to sliding-rotation intervals.
- Discrepancy between the expected hook load and actual measurement.
- Stiffness dissimilarity between current BHA and BHA used to drill previous intervals.
- A real-time drilled lithology proxy, such as a gamma ray overlay or ROP.
DIP models
Fuzzy C-Means, long short-term memory (LSTM) RNN, and LSTM-autoencoder (LSTM-AE) models trained on FORGE drilling data. Fuzzy C-Means grouped the data into risk-related clusters and assigned membership to the groups. The number of clusters (the correct number of risk levels) was initially unknown. An initial assumption could have been that there were only two clusters (low and high risk), but that would not account for data points poorly represented by either of these clusters. A fuzzy partition coefficient (FPC) estimated the optimum number of clusters based on FORGE drilling signals and determined that three clusters best represented the data.
In the FORGE analysis, the coefficient controls the overlap between problem-free signals and problem-related signals. This parameter is tuned to produce the highest number of true-positive drilling predictions based on ROC analysis when building the model. If the fuzziness coefficient is too low, then the clusters will not overlap, and the model will produce a high number of false positives. If the fuzziness coefficient is too high, the clusters overlap too much, and the model will either miss all anomalies or mark everything as anomalous. True positive and false positive results are normalized between 0 and 1 for model comparisons.
RNN forecasts real-time signals and the autoencoder learns to reproduce normal conditions by forcing a compressed representation of the data while minimizing the reconstruction error of these data.
Pure data-driven models trained on drilling data which were divided into tripping and drilling feature spaces. Delineating drilling into separate operations improved model accuracy by focusing model training only on specific features of each type of operation. Tripping signals included hook load, block position, discrete derivative of hook load and block position with respect to time, and the overlap between stiffest portion of the bottom-hole assembly (BHA) and rotation-slide transitions. The training dataset did not contain any sticking-related anomalies. These data produced models which only predicted problem-free drilling conditions to compare with real-time drilling data and model analysis.
Drilling signals include standpipe pressure, flow rate, surface rotation speed, surface torque, discrete derivatives of these signals, and rate of penetration. This feature space also includes variables from tripping operations, illustrating how separating feature spaces for training eliminates extraneous drilling signals from tripping operations.
The hybrid approaches include a third feature space. These features derive from physics-models and included tortuosity index at the drillstring contact points, presence of cuttings at the contact points based on the cuttings transport model, and deviation of hook-load signal with respect to expected pickup-slack-off weight per torque and drag simulation.
Training data preparation involved four tasks. First, data channels were inspected for missing, redundant, or irrelevant values. Examples of irrelevant data for pipe sticking predictions include H2S level, pit gain or loss, slips set, or pump strokes. Second, the feature space was expanded to include geometry-related drivers. These features include a binary label indicating overlap between the stiffest section of the BHA and slide-rotate transitions, discrepancy between the expected HKL derived from torque-and-drag simulations and real-time measurement, tortuosity index at contact point depths, and stiffness difference between the current running BHA and the ones used to drill previous intervals.
Fig. 4 illustrates these features. They are ideal for the FORGE application because they are available in real-time, like sophisticated methods to assess wellbore quality. The tortuosity index does not require advanced modeling or additional tools in the string.
The third step defines the local sliding window and a macro time window frame. A local sliding window of 10 sec with a 5-sec overlap between consecutive windows smooths the data. This window size ensures a model with sufficient resolution and enough time to take appropriate actions in the event of a triggered warning. The macro time frame evaluates the accuracy of the model. In the case of stuck-pipe incidents during tripping, the time starts when the BHA enters the hole. For stuck pipe incidents during drilling, the timeframe starts from bit break-in.
The final step calculates mean, skewness, and standard deviation using the sliding window for each time step. Normalization of the resulting dataset removes bias from parameters with distinct scales. Data are divided between drilling and tripping operations, selecting variables in each group based on their importance in the operation.
Well 56-32 stuck-pipe prediction
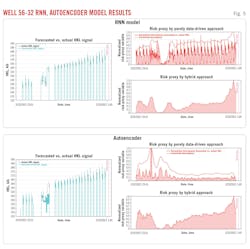
Pipe-sticking prediction for well 56-32 included forecasting, representation learning, and clustering models using both purely data-driven and hybrid approaches. Both the forecasting and representation learning models accurately reproduced tripping signals (Fig. 5). The left graphs illustrate predicted vs. actual hook load signal, and dotted lines indicate the stuck pipe incidence. Right-side graphs illustrate risk-proxy signals.
Both forecasting and representation learning models accurately predict hookload under normal conditions. The high-risk conditions leading to stuck pipe were not indicated by risk-proxy variables which relied exclusively on deviation from normal drilling conditions. By contrast, risk-proxy variables incorporating physics-based simulations consistently increased closer to the stuck-pipe incident time.
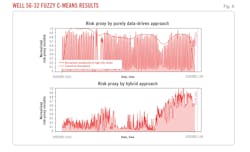
Fig. 6 shows results from the fuzzy logic model. Like the previous modelling results, the hybridized clustering model better predicts sticking risk as the string approaches the actual sticking point. Furthermore, this hybrid sticking risk exhibits less fluctuation and is reduced in time intervals that are not associated to risky conditions.
Using hybrid models, forewarning windows associated with both the RNN and the autoencoder are similar (11- and 13-min long, respectively). Conversely, the forewarning window of the risk-proxy signal from the hybridized fuzzy clustering model was 22-min long, which could provide more time on rig for preventative measures. Moreover, this risk-proxy signal is more effective in capturing normality than the other models. When reconstruction error or forecasting deviation are used as proxies, they tend to produce a more conservative risk index, potentially leading to unnecessary preventative measures.
Model accuracy
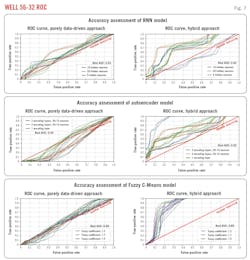
Risk-proxy variables were converted to normalized sticking warnings by applying sliding windows and thresholds (Fig. 7). Six ROC curves show risk assessment for data driven and hybrid models. Curve colors represent hyperparameter variations in each model. The fuzziness coefficient controls the degree of overlap between low- and high-risk clusters in the fuzzy clustering model. The number of hidden layers, number of hidden neurons per layer, and the width of the forecasting-reconstruction window represent hyperparameters in the neural network models. Distinct curves of the same color indicate variations in the width of the sliding window for warning generation.
Random guessing falls on the 1:1 line between true positive and false positive results. Best model results appear in the upper left quadrant of the graphs where models preferentially show true-positive rate results over false positives. Hybrid stuck pipe predictions outperform purely data-driven predictions in both accuracy and number of false warnings.
Many of the pure-data model predictions fall near the random guessing line. This is due to the small dataset available at FORGE for model training, not only in number of wells drilled but in the variety of BHAs, well trajectories, hole sections, types of fluid, etc. Well 56-32 illustrates this point as it is the only well to use a mud hammer and roller reamer BHA rather than PDC/PDM or tricone bit/PDM BHA. The former BHA is stiffer and behaves differently than the other BHAs, but it is not represented in the training data.
Another risk of employing semi-supervised pure data sticking predictors, such as derived from RNN and autoencoder models, includes semi-supervised training data preparation. The models may train on data with early sticking symptoms and erroneously assume such conditions are normal. Supervised models address these concerns by manually coding time-series data as stuck or not stuck, but these assignments also introduce uncertainty.
Hybridization captures more drilling processes than data-driven models, providing added criteria to assess the drilling state. For example, cuttings production estimates combined with cuttings-transport simulation provide annular packoff estimates crucial for sticking prediction. This sticking-risk factor cannot be directly observed from sensors or directly inferred from variations in standpipe pressure. Likewise, torque and drag simulations monitor changes in friction factors which may, combined with predicted standpipe pressure deviations from cutting-transport simulations, suggest degradation of the wellbore condition requiring further attention before entering a high-risk sticking state.
Additional FORGE well analysis
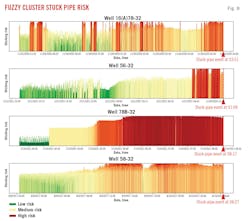
Four FORGE well sticking events were simulated using the Fuzzy C-Mode approach to determine if the model could accurately predict the stuck-pipe incidents. Fig 8 shows low-, medium- and high-normalized stuck-pipe risks for 16(A)78-32, 56-32, 78B-32, and 58-32.
In each well, the sticking event occurs at the last time stamp registered in each panel. Low-, medium-, and high-risk parameters are clustered, and the graphs show the relative population of each cluster in real time. High-risk clusters become more populated in the timeframe before a sticking event. Medium- and high-risk cluster populations in the prediction window provide true-positive alert warnings.
Erroneous stuck predictions occurred in well 58-32 on Nov. 25 at about 23:50 and again around 01:00 on Nov. 26. These alarms were triggered when contact points traversed risky transitions. When sticking occurred while entering the igneous rock, however, the model correctly captured the reduction in sticking risk when the string was lifted off bottom after the first torque spike. The clustering was not as clear as it was in the other wells, and expansion of the feature space with more lithology characterization would have aided in stuck pipe predictions in this well.
Overall, all sticking symptoms were successfully captured with a low number of false alarms using a tuned fuzziness coefficient. The model anticipated geometric events which lacked clear real-time signals. The model achieved 0.88 true positive and 0.12 false positive for the four case studies combined. These early alerts would have provided timely warnings for taking action to prevent a stuck-pipe condition.
Bibliography
Montes, A.C., Pradeepkumar, A., van Oort, E., “Stuck Pipe Prediction in Utah FORGE Geothermal Wells,” SPE-214783-MS, 2023 SPE Annual Technical Conference and Exhibition, San Antonio, Tex., Oct. 16-18, 2023.
Montes, A.C., Pradeepkumar, A., van Oort, E., “Review of Stuck Pipe Prediction Methods and Future Directions,” SPE-220725-MS, SPE Annual Technical Conference and Exhibition, New Orleans, La., Sept. 23-25, 2024.
Montes, A.C., Pradeepkumar, A., van Oort, E., “Comparing Drilling Anomaly Prediction by Purely Data-Driven and Hybrid Analysis Methods - Case Study of Utah FORGE Geothermal Wells,” ADC/SPE-217737-MS, IADC/SPE International Drilling Conference and Exhibition, Galveston, Tex., Mar. 5-7, 2024.
The authors
Pradeepkumar Ashok ([email protected]) is a senior research scientist at the University of Texas at Austin. He holds a PhD (2007) in Mechanical Engineering from the University of Texas at Austin. He is a member of the Society of Petroleum Engineers (SPE).
Abraham C. Montes ([email protected]) is a PhD student at The University of Texas at Austin. He holds a BS in Petroleum Engineering (September 2014) and an MS in Systems and Computational Engineering (March 2022) from Universidad Nacional de Colombia and Pontificia Universidad Javeriana, respectively. He is a member of SPE.
Eric van Oort ([email protected]) is a professor holding the Richard B. Curran Centennial Chair in Engineering at the University of Texas at Austin, and is CEO of EVO Energy Consulting LLC. He holds a PhD (1990) in physical chemistry from the University of Amsterdam. He is a member of SPE.
Alex Procyk ([email protected]) is the upstream editor at Oil & Gas Journal. He holds a BS (1987) in Chemistry from Kent State University and a PhD (1992) in Chemistry from Carnegie Mellon University. He is a member of SPE.


