New satellite algorithm detects methane emissions
Methane leaks result in significant economic losses and liability. The paucity of accurate emission data hinders correction of leaking sites and emission sources. Momentick Ltd. provides algorithms which use third-party satellite data to detect and quantify methane plumes. The algorithms imaged 50 assets in Midland basin which included wells, metering stations, pipelines, and compressor stations from 2020-24.
Analysis revealed methane plumes from 18 unique sites which were above the US Environmental Protection Agency’s (EPA) super-emitter threshold. Most of these site’s emissions originated from wellheads. A separate study using satellite data covering eight Turkmenistan assets showed 108 methane leaks in six of the assets. In both cases, actual methane emissions were higher than expected based on traditional methane measurements.
Methane leak detection
Effective May 7, 2024, the EPA implemented its final rule for methane emissions. The rule includes a waste emission charge on “super emitter” releases above 100 kg/hr, making timely detection and quantification of these releases critical. Routine satellite surveillance can reveal releases missed by ground-based or aerial surveillance, and satellite data can also quantify releases under or overrestimated by calculation or qualitative observation.
Methane leaks also result in significant economic losses, costing the global gas industry about $60 billion annually. A 2018 study found a methane leakage rate of 2.3% from oil and gas operations. Capturing and selling this methane could increase natural gas producers' revenues by an estimated $188 million yearly.
As satellites increase their ability to detect methane point-source emissions, software solutions which rectify and utilize data from existing and future satellites to quantify methane fugitive emissions will provide important data for global greenhouse gas mitigation efforts. The Global Methane Pledge aims for a 30% reduction in methane emissions by 2030.
Undetected emissions pose a significant problem as their quantities remain unknown. The US alone has about 300,000 oil and gas wells and more than 2 million miles of pipeline. Less than 10% of these gathering and transmission pipelines undergo regular leak inspections. US natural gas distribution pipelines have about 630,000 estimated methane leaks and contribute to US methane emissions estimated to be 60% higher than official EPA figures.
Timely leak detection provides a basis for correction. An Environmental Defense Fund (EDF) report states that annual monitoring results in about 40% less methane emissions than would be expected without monitoring and correction. Quarterly monitoring results in 60% less methane emissions, and monthly monitoring results in 80% less emissions.
The lack of accurate data hampers efforts by industry stakeholders, governments, international bodies, and financial institutions to address methane emissions effectively. This issue can be addressed by accessing satellite constellation data which offer global coverage with high resolution. Sensors on these satellites, however, are not specifically designed to detect methane leaks and do not provide optimal imaging for this service. Emission rates determined from these sensors suffer from inadequate signal-to-noise-ratio (SNR), wide spectral bands, and the absence of optimal wavelengths. A combination of physics, remote sensing, and data-driven algorithms for detecting and quantifying methane plumes helps address these issues. The process involves three steps.
First, advanced signal processing and unsupervised learning techniques handle low SNR and identify spectral signatures of the materials in the image. Next, custom-trained artificial intelligence (AI) models determine whether methane is present in the image. Finally, further AI models determine the location of the plume and calculate the emissions rate. Emission rates are reported in kg/hr, and plume concentration is reported in parts per million (ppm).
The quality of results depends on the ability to consistently generate a unique methane-free image to establish a scene’s background. This image amplifies the presence of methane, increasing the effectiveness of the AI model training process.
Satellite imaging
A dedicated application programming interface (API) collects hyper- and multi-spectral satellite data in several short-wave infrared (SWIR) bands. The algorithm combines satellite images from a deep-learning model and physics-driven algorithms to mark the methane plume. Model calibration uses simulations containing training data, aerial imagery analysis, and controlled release experiments. Model validation compares the algorithm’s results against published data and airborne sensors. In general, the algorithm produced an error margin of about 10%.
Operation monitoring begins with the selection of a region that requires detailed observation. Once a region is identified, it is converted into a polygonal shape on a digital map. This polygon represents the precise boundaries of the area of interest, ensuring that all subsequent monitoring activities are accurately focused within this defined perimeter.
With the polygonal region established, the next step involves labeling the assets within this area using an extensive oil and gas database. This database provides comprehensive information on various assets, including wells, pipelines, and other infrastructure. By leveraging these data, all relevant assets within the polygon are accurately identified and categorized. Each asset is assigned specific labels and metadata, such as operational status, ownership, production capacity, and historical performance data.
Once the region and its assets are clearly defined and labeled, satellites monitor the area. This involves scheduling satellite observations according to a predefined frequency that aligns with the specific monitoring needs of the region. The satellites used for this purpose include advanced Earth observation platforms like Sentinel-2, Landsat 8, and Landsat 9, amongst other commercial satellites.
These satellites are equipped with high-resolution multispectral and thermal sensors capable of capturing detailed imagery and data. The monitoring process involves:
- Data acquisition. Satellites capture data from the polygonal region at scheduled intervals. These data include visual imagery, thermal readings, and spectral data which indicate various environmental and operational conditions.
- Data processing and analysis. The acquired satellite data are processed and analyzed to extract meaningful insights.
- Advanced algorithms and machine-learning techniques detect changes, anomalies, and trends within the region. This analysis identifies new developments, tracks asset performance, and detects potential issues such as leaks.
- Reporting and alerts. The results of the data analysis are compiled into detailed reports which provide a comprehensive overview of the region's status. These reports include visual maps, statistical summaries, and actionable insights. Additionally, real-time alerts notify stakeholders of any significant changes or potential issues that require immediate attention.
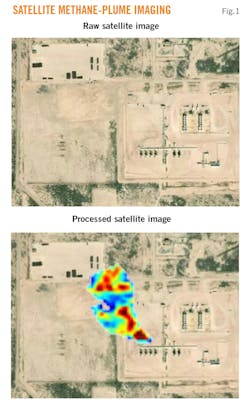
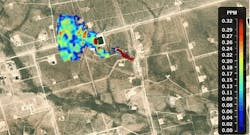
Fig. 1 shows an example of the raw satellite image and the processed image showing a methane plume. The plume is color-coded in a heat map based on methane concentration.
Midland emission case history
Midland basin contains wells, pumps, compressor stations, metering stations, and pipelines which all potentially contribute to methane emissions. The high density of leak sources challenge ground-based and areal leak detection and remediation (LDAR) programs, but the area is ideal for satellite-based emission surveillance.
Fifty randomly selected assets for methane leak analysis spanned Midland, Andrews, Ector, Crane, Glasscock, Upton, and Martin counties. Chosen areas included wells, metering stations, pipelines, and compressor stations of multiple operators. The search was limited to 2020-24.
The trained algorithm processed a large dataset of historic satellite imagery and live data-streams from multiple satellite constellations to detect localized methane signals in hyperspectral bands of the images. The analysis report produced emission rate estimations, ownership status, and time-series analysis of plume progression. The results were checked and validated by a subject matter expert.
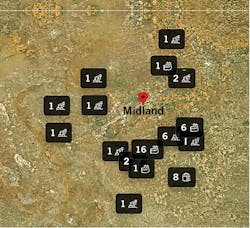
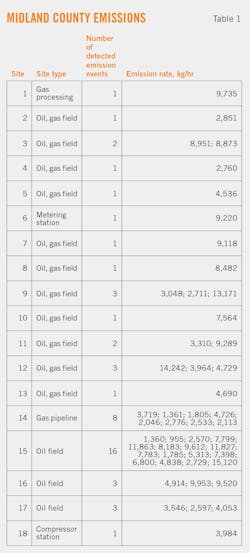
An analysis revealed methane plumes from 18 unique locations (Fig. 2). All detected plumes were above the EPA’s super emitter threshold (100 kg/hr), with most producing more than 4,500 kg/hr. Five locations produced more than 10,000 kg/hr (Table 1). Most emissions originated from wellheads.
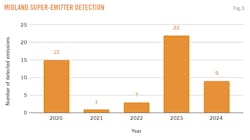
Fifteen methane plumes occurred in 2020, a rate which declined to the low single digits for the next 2 years before spiking to 22 plumes in 2023 (Fig. 3). Emissions in 2023 resulted from high completion activity in 2022, during which more than 11,000 wells were completed compared with an average of about 2,000 wells each in 2020, 2021, and 2023.
Fig. 4 illustrates the emissions profile of a well pad using the satellite imaging algorithm. The algorithm calculated an emission rate of 1,360 kg/hr. Point sources were detected with an accuracy of 4 m.
Turkmenistan emission case history
Turkmenistan emission intensity (EI - the amount of methane released per unit of energy produced) ranks highest in the world in the International Energy Agency (IEA) worldwide methane emissions database, at 13 kg methane/gigajoule (GJ). For comparison, the average US EI is among the lowest at 1.6 kg/GJ.
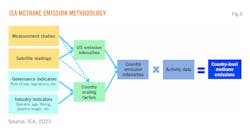
IEA estimates worldwide emissions indirectly by multiplying a country’s EI with its volumetric production (Fig. 5). Country-specific EI comes from a country-scaling factor referenced to US EI based on areal measurements, satellite measurements, and emission factor calculations. EI scaling is based on country-specific data. For upstream emission intensities, scaling depends on the infrastructure age, type of in-country operator (international, independent, or national oil company) and average flaring intensity (flaring volumes divided by oil production volumes). For downstream emission intensities, country-specific scaling factors depend on the extent of oil and gas pipeline networks and oil refining capacity and utilization.
Also affecting scaling is the strength of regulation and oversight, government effectiveness, regulatory quality, and the rule of law as supplied by World Bank Worldwide Governance Indicators.
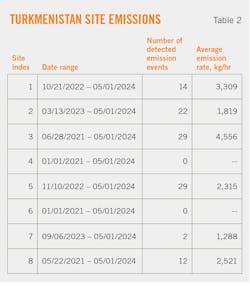
Given these assumptions and the indirect nature of IEA’s country-specific methane emission volumes, Momentick processed 2024 satellite data to directly quantify methane emissions in eight Turkmenistan assets. Between January 2021 and April 2024, 108 methane leaks were identified in six of the assets. Table 2 lists eight sites imaged for methane emissions showing emission rates of 1,288-4,556 kg/hr. These results confirmed that Turkmenistan has high emission volumes and EI, in line with IEA’s estimates.
Bibliography
Carrington, D., “’Mind-boggling’ methane emissions from Turkmenistan revealed,”
The Guardian, May 9, 2023.
Environmental Defense Fund, “New Study Finds U.S. Oil and Gas Methane Emissions Are 60
Percent Higher than EPA Reports,” June 21, 2018.
IEA, “Documentation, 2023 version,” Global Methane Tracker, Feb. 21, 2023.
IEA, Global Methane Tracker, 2024.
Momentick, “Methane Leak in Balkan, Turkmenistan,” Methane Emissions Report, 2024.
Silverstein, K., “Capturing Methane From Oil and Gas Operations is Doable and Profitable,” Forbes, May 10, 2021.
About the Author
Alex Procyk
Upstream Editor
Alex Procyk is Upstream Editor at Oil & Gas Journal. He has also served as a principal technical professional at Halliburton and as a completion engineer at ConocoPhillips. He holds a BS in chemistry (1987) from Kent State University and a PhD in chemistry (1992) from Carnegie Mellon University. He is a member of the Society of Petroleum Engineers (SPE).
