Analysis used to assess, improve drilling performance
Perfect-well analysis can quantitatively, unambiguously, and simply assess drilling performance and offer a method to set performance targets and identify where savings can most likely be found. This is the first of two articles that introduce a concept called "perfect-well analysis."
Just what should a well cost?
One difficult part of assessing drilling performance is comparing wells in different situations: different depths, lithology, complexity, hole programs, business units, etc. When a driller says he "saved" 10%, it is difficult to know if these were legitimate savings or if the original AFE was just too conservative.
The difficulty in nailing down what wells should really cost sometimes creates unproductive tension between drilling organizations and their internal customers. Concepts such as unscheduled events, benchmarking, drilling learning curves, and more recently the technical limit1 2 have helped to clear up the situation, but they can still leave open grounds for debate.
This is particularly true in areas without readily comparable industry benchmarks.
The basic idea is that when you know the gap between current drilling performance and what is possible, you are able to quantify the benefits of improvement and implement measures to capture those improvements. If you know what's possible, you're more likely to find ways to save capital dollars.
What is the perfect well?
The "perfect-well time" described here is the minimum time in which a well could possibly be drilled and is calculated from clearly defined physical factors that constrain the drilling time: the rock strength, operational limits, number of casing strings, hole size, etc.
Briefly, the perfect-well time isn't the "best observed time," the "best of the best" time, the P90 time, the "best offset" time, or even the "technical limit." It is the physical limit that represents how fast the well could possibly be drilled limited by the physics of the drilling process.
Given a geologic sequence, a hole-size program, mud weight, and a particular rig, physics dictate how fast drilling operations can be conducted. It takes energy to cause rock to fail; given 100 hp to apply to the bottom of a well, you will be able to break a certain strength rock only so fast, even with a perfectly sharp bit and perfect hole cleaning.
Perfect-well analysis uses such physical limits to find a close approximation to the minimum time in which a well could possibly be drilled.
It assumes one bit per hole section with penetration rate limited by rock strength and the horsepower available from the rig, perfect casing and cementing operations, and perfect trip times.
The only inputs needed for this analysis are the hole-size program, an estimate of the rock strength (accurately derived from a sonic log or seismic travel times in the area), pore pressure, and a few parameters about the drilling rig to be used.
The idea becomes practical through use of a simple spreadsheet technique that can estimate the perfect-well time in just a few minutes or as an automatic parameter output of a typical drilling database.
The "perfect-well ratio" (PWR), a dimensionless parameter calculated as the ratio of the actual time to the perfect time, allows comparison of wells in different conditions to a common benchmark of perfection. For example, a PWR of 2.1 means that the subject well took 2.1 times longer than the perfect well to drill.
As will be discussed below, the parameter honors differences in well configuration and lithology and allows for comparisons across different well types.
A benchmark
Just like building a 100% mechanical efficiency engine, it is impossible to drill the perfect well.
But the PWR approach can gauge a particular drilling operation's efficiency, just as comparing the efficiency of a particular engine to what is theoretically possible can tell you how the engine performs.
The perfect-well concept is not meant to replace a rigorous technical limit process. It identifies a performance level and infers opportunities to improve, not how to improve. A properly conducted technical limit process can identify how to improve.
Even though it should not replace other performance-analysis techniques, perfect-well analysis can improve these techniques because it is easy to determine and provides a quantitative benchmark that is not open to human interpretation. Most importantly, it puts the performance conversation on a completely quantitative footing; it sets an objective "stake in the ground."
Compared to the technical limit, one benefit of the perfect well is that it is not open to human judgment. There are numerous examples for which the technical limit—supposedly the "best" a well could practically be drilled—has been beaten and beaten badly. In those cases, faulty human judgment created a technical limit that did not reflect an actual limit. (Note: the next article in this series shows that in one case the PWR correlated with much more difficult-to-produce technical limit with a correlation coefficient of 0.98.)
Knowing the "perfect-well time" is a bit like knowing the "irreducible oil saturation" of a reservoir. Just as comparing the oil in place with the irreducible saturation identifies opportunities for improved production, the PWR can identify opportunities for improved drilling performance.
Operations relatively close to their perfect well will be difficult to improve, and those farther away should be easier to improve.
The PWR can also be used to identify situations in which application of drilling technology, engineering, or operational expertise could yield performance improvements, can quickly and easily compare drilling performance across different well types and operators, validate estimates and performance in nonoperated situations, and check the objectivity of various other drilling performance metrics (such as the technical limit).
Analyzing drilling performance
PWR analysis was developed as part of a worldwide review of Occidental Oil & Gas Corp.'s well construction operations.
As do many large operators, Oxy has various types of drilling operations in many different business units all over the world.
One inherent difficulty in analyzing performance in such situations is accounting for all the differences between the various types of wells (well depth, rock strength, pressure regime, hole size program, vertical, directional, horizontal or multilateral, rank wildcat vs. routine development, etc). PWR analysis was developed as a method to assess these diverse operations.
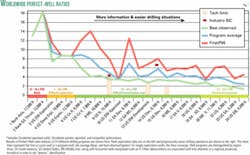
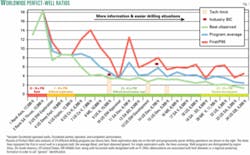
Fig. 1 summarizes PWR for more than 500 wells in 24 different actual drilling programs worldwide. The programs varied from 4,200 ft to 19,800 ft in depth, from deserts to jungles, from rank wildcats to routine developments, on and offshore, on four continents.
The programs included drilling activities operated by Oxy, Oxy's partners, competitors, and two program operations managed by an integrated project management provider.
Detailed analysis of each program (described in detail in the next article in this series) confirms more difficult-to-produce findings from technical limit, learning curve analysis, and benchmark studies, and shows how the PWR can be used to as an easy key performance indicator of drilling performance.
The operations in Fig. 1 are numbered roughly in order of technical difficulty from left to right (1 being the most difficult and 2 being the technically easiest).
The horizontal axis shows the type of operation and well depth. Additionally, some of the programs had industry best-in-class offsets or rigorously defined technical limits. Where available they are also shown in the figure.
Create performance standards
Fig. 1 shows a use of the PWR concept. By classifying different types of wells and programs into different groups (e.g., rank exploration, difficult exploration, difficult development or routine exploration, and routine development), one can use the PWR as a key performance indicator to identify operations that are not performing as well as they might or have demonstrated best practices that could be shared with other areas of the company.
Detailed investigation of programs with the best PWR performance yielded insight into project management discipline, well planning, and program design.
Before the PWR, differences in hole size, rock strength, operational objectives, made it difficult to assess a particular operation's efficiency in an absolute sense.
With the perfect-well concept, drilling organizations that thought performance is "good" clearly have opportunities for improvement.
PWR standards for different types and complexity of operations can then be defined to classify wells by different degrees of difficulty.
This aids new venture or project capital estimates that may now be made with demonstrated worldwide knowledge of like drilling performance, organizational learning rates, and regional understanding of drilling costs.
For example, this broad set of data shows that a perfect-well ratio of more than about 3.5 for routine development drilling operations would indicate an opportunity for improvement compared with what is commonly achieved elsewhere.
What's coming
Perfect-well analysis provides an objective method to measure drilling performance.
Once limiting parameters are assumed, one may evaluate a portfolio of drilling program in terms of performance and identify areas to apply resources that most likely will result in improvement actions yielding better results.
The next article shows how the perfect-well method can be used to:
- Analyze a diverse portfolio of drilling operations.
- Validate other drilling performance methods.
- Gauge organizational and technical performance.
- Separate learning curve benefits from technical program changes to gauge change effectiveness.
- Estimate cost improvement targets.
- Allocate resources.
Acknowledgments
The authors thank Mike Walker, Morris Keene, Leon Robinson, and Morgan Jones for their assistance and advice in creating this concept.
References
1.Bond, D.F., Scott, et al., "Step Change Improvement and High Rate Learning are Delivered by Targeting Technical Limits on Sub-Sea Wells," IADC/SPE Drilling Conference, New Orleans, Mar. 12-15, 1996.
2.Brett, J.F., and Millheim, K.K., "The Drilling Performance Curve: A Yardstick for Judging Drilling Performance," 61st Annual SPE Technical Conference and Exhibition, New Orleans, Oct. 5-8, 1986.
3.Pessier, R.C., and Fear, M.J., "Quantifying Common Drilling Problems With Mechanical Specific Energy and a Bit-Specific Coefficient of Sliding Friction," 67th Annual SPE.Technical Conference and Exhibition, Washington, Oct. 4-7, 1992.
4.Onyia, E.C., "Relationships Between Formation Strength, Drilling Strength, and Electric Log Properties," 63rd Annual SPE Technical Conference and Exhibition, Houston, Oct. 2-5, 1988.
5.Detournay, E., and Tan, C.P., "Dependence of Drilling Specific Energy of Bottom-Hole Pressure in Shales," SPE/ ISRM Rock Mechanics Conference, Irving, Tex., Oct. 20-23, 2002.
The authors
Ed Behm is production coordinator, Occidental Oil & Gas Corp., reporting to Oxy's executive vice-president of worldwide production and general management of all Oxy's oil and gas operations. Behm joined Oxy in 1981 and has held various Oxy asset/engineering management positions. In addition to operating area assignments, he was a director in the Oxy corporate financial planning and analysis department. Behm received a BS in petroleum engineering from the University of Tulsa in 1980. He is a member of SPE and was a director of the Permian basin and San Joaquin sections. Behm is also a member of the PBPA (Permian Basin Petroleum Assoc.) and was Chairman of the 1998 PBOGRC (Permian Basin Oil & Gas Recovery Conf.). He served on the executive committee of CIPA (California Independent Petroleum Assoc.).
J. Ford Brett is president of OGCI/PetroSkills where he consults in petroleum project management. Prior to joining OGCI in 1991, Brett worked with Amoco Production Co. on numerous exploration and development drilling projects. Brett has served as an SPE lecturer and review chairman for the SPE's "Drilling and Completion Engineering Journal." He holds a BS in mechanical engineering and physics from Duke University, an MBA from Oklahoma State University, and an MSE from Stanford University.


