Machine-learning AI enhances Permian basin drilling
Based on “From Science to Practice: Improving ROP by Utilizing a Cloud-Based Machine-Learning Solution in Real-Time Drilling Operations,” SPE/IADC-204043-MS, SPE/IADC International Drilling Conference and Exhibition, Virtual, Mar. 8-12, 2021.
A cloud-based drilling model has been deployed in the Permian basin to improve rate of penetration (ROP) using a data-driven machine learning model in real time. The method differs from previous AI drilling approaches by using differential pressure (DP) across the positive displacement motor (PDM) as the key input parameter rather than weight on bit (WOB). Additionally, the model consumes live wellsite information transfer standard markup language (WITSML) at 1-sec intervals to generate ROP predictions using lagged parameters.
Field trials showed ROP improvements of 19-33% compared with control footage, and 5-33% overall compared with offset wells.
Model design
The drilling model was developed for horizontal wells, for which surface WOB measurements can be a misleading indicator of downhole WOB due to drag and poor weight transfer. PDM DP, however, can be directly related to PDM torque using a downhole pressure gauge and the manufacturer’s specifications, assuming bit torque equals PDM torque. PDC WOB is then obtained from linear correlation to PDM bit torque. This method depends on assumptions of similar bit wear and formation characteristics between training models and subject wells.
Lagged-input features, the most recent values of inputs for real time predictions, improve model accuracy. Mechanical specific energy (MSE) is the key lagged feature for ROP, which is part of the MSE equation, and the model calculates the previous 10 ft of MSE using actual ROP to make forward ROP predictions.
The model needs rapid formation analysis to keep up with drilling, but formation characteristics are not typically available in real time. Gamma ray measure-while-drilling (MWD) data is available in real time, but typically 30 ft behind the bit. MSE, therefore, stands in for formation drill resistance closer to the bit.
Singh details the machine learning model.1 Field trials varied working motor DP and surface rpm recommendations in steps to compare actual with predicted ROP. DP was zeroed after every connection to ensure the machine learning recommendation did not skew due to erroneous measurements. Mean absolute percentage error (MAPE) was compared with the pretrial objective of 15% to see if the model significantly improved standard practice.
Four key learnings came from the field trials:
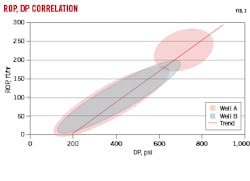
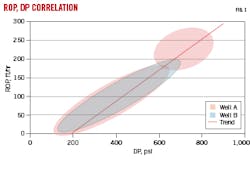
- Drillers were more comfortable with WOB than DP as a key controllable drilling parameter. Some auto-drillers are not set up to use DP as a set point. A real-time regression analysis was developed to correlate DP recommendations to WOB using the last 100 ft of rotary drilling data. A crossplot between ROP and DP for two wells shows excellent correlation between the two parameters (Fig. 1).
- Improperly set auto-driller setpoints resulted in conflicts in drilling parameter limits. ROP, WOB, DP, and torque started fluctuating, reducing drilling efficiency. A real-time statistical model was deployed that computes coefficient of variation and provides low-, medium-, and high-dysfunction alerts.
- Torque-swing ratio (TSR) is computed in real time and reported as low, medium, or high alerts.
- Adding user-defined limits prevented the model from recommending parameters beyond acceptable bounds. Limits on DP were dictated by maximum allowable motor pressure DP. Rotary torque was limited to maximum drill pipe makeup torque. Standpipe pressure was limited by pipe and equipment pressure ratings, and WOB limits were based on bit specifications.
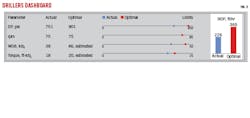
An integrated dashboard was created to display real time data, recommendations, and limits (Fig. 2). The bar chart shows actual vs. optimum ROP. Real time drilling parameters, both actual and recommended, are listed along with their relative positions against their limits. Dysfunction or high TSR value alerts were issued in real time. A 6-hr lookback track was plotted for actual vs. optimal parameters with respect to either ROP, rpm, DP, torque, or WOB. Dysfunction flags were displayed along the track, corresponding to hole depth.
Field trials
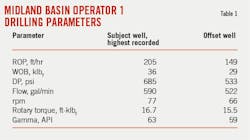
Field trials were conducted with two operators in Midland and Delaware basins. Table 1 shows average ROP and drilling parameters for a subject well relative to an offset well in the same Wolfcamp A target formation for Midland basin Operator 1. Gamma-ray values were similar among wells drilled with the same bottom-hole assembly (BHA) and drill-bit type.
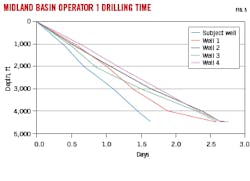
Average subject well ROP was 205 ft/hr compared with 149 ft/hr for the offset well, a 36% improvement. Fig. 3 shows depth vs. time of the subject well lateral vs four offset wells. Target depth was reached 0.75 days earlier than the best offset well.
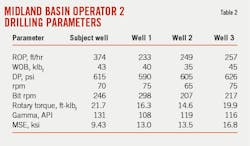
Table 2 summarizes the subject well performance from Midland basin Operator 2 relative to three offset wells. Wells were within a 5-mile radius in the same Wolfcamp A target formation and drilled using an 8 1/2-in. conventional assembly. Rotary ROP improved by 31% over offset wells, with 374 ft/hr average ROP for the subject lateral compared with 246 ft/hr average for offset wells.
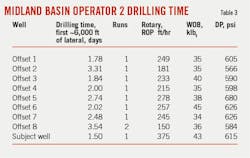
Table 3 summarizes days required to drill the first 6,000 ft of lateral, number of trips required, rotary ROP, WOB, and DP for the subject well and eight offset wells. The subject well was drilled in a single run with a highest average ROP of 1.5-days, compared with 2.45 days for offset wells.
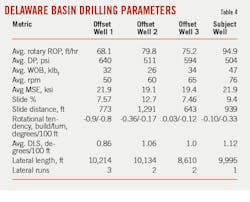
Table 4 summarizes subject-well drilling parameters against three offset wells in Wolfcamp B, Delaware basin. All were drilled with an 8 ½-in. PDM and bit. Subject well average ROP was 95 ft/hr compared with 75 ft/hr for offset wells, a 27% improvement. The subject well was drilled in one run. Offset wells required multiple runs.
A test of the ML system drilled the first stands while ignoring ML recommendations and the next two stands adopting the recommendations. Table 5 summarizes the results. There was a 19% ROP improvement from 11,312 ft to 11,507 ft while following the recommendations.
MWD vibration, rotary trend
ML improved ROP performance, but a check was required to ensure that harmful vibrations or increases in sliding percentage from directional divergence were not introduced by rigorously following recommendations. MWD axial and lateral shock data were obtained post-run and analyzed for vibrations. Harmful shock thresholds were obtained from the MWD tool vendor.
Highest combination of axial and lateral shock occurred at 475 psi DP and 78 rpm, resulting in 4.6g and 5.3g, respectively. Maximum vendor threshold is 10g, and the observed maximum shock is considered only moderate.
During drilling, the ML tool recommended higher drilling parameters for rotary drilling than offset wells. A post-run rotary trend analysis (RTA) was performed to ensure that ML recommendations would not lead to higher directional divergence, increasing sliding time and reducing drilling time.
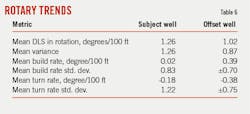
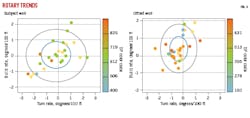
RTA correlates drilling parameters to a BHA rotary drilling build-and-walk tendency. RTA only plots drilling stands in which rotary drilling was used exclusively between previous survey depth and current survey depth intervals. Fig. 4 plots turn and build rates in the lateral against DP. The color code corresponds to median DP. Blue and white ellipses are one and two standard deviations of build and turn rate, respectively. Mean build and turn rates are used for the radii of the ellipses. Note that the DP range and color coding is different for the two wells: the subject-well high range is 820-900 psi, and the offset-well high range is 630-700 psi.
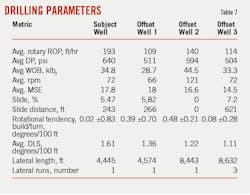
Mean build rate and mean turn rate are lower for the subject well than the offset well. Table 7 summarizes drilling parameters and shows that the subject well has the highest average ROP and lowest sliding percentage against three offset wells.
Auto-driller dysfunction
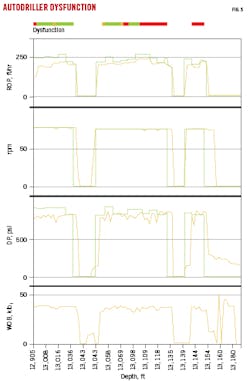
Auto-driller dysfunction was flagged during the trial. Fig. 5 shows the red dysfunction flag starting at about 13,100 ft. Fluctuations were observed in ROP, DP, WOB, and torque. The drilling rig was contacted in real time during the dysfunction and corrections were made to tune the auto-driller settings.
Prediction accuracy
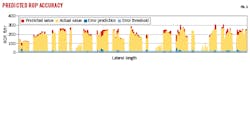
Testing of the ML model was performed over 10 wells with three different shale operators. Prediction accuracy was within the 15% MAPE requirement for the project, even for formations not included in the training date. Fig. 6 shows actual vs. predicted ROP for a trial lateral section. Yellow is actual ROP and red is predicted ROP. The light blue bar is a 15% error band, and the blue plot is actual error percentage. The error is under 15% for most of the lateral.
References
- Singh, K., Yalamarty, S.S., Kamyag, M., and Cheatham, C., “Cloud-Based ROP Prediction and Optimization in Real Time Using Supervised Machine Learning,” URTEC-2019-343, Unconventional Resources Technology Conference, Jul. 31, 2019.
About the Author
Alex Procyk
Upstream Editor
Alex Procyk is Upstream Editor at Oil & Gas Journal. He has also served as a principal technical professional at Halliburton and as a completion engineer at ConocoPhillips. He holds a BS in chemistry (1987) from Kent State University and a PhD in chemistry (1992) from Carnegie Mellon University. He is a member of the Society of Petroleum Engineers (SPE).
