Lower Wolfcamp HFTS produces from anomalous water sources
Ron Dusterhoft
Neil Stegent
Nicholas Garrison
Robert H. (Bob) Gales
Halliburton
Houston
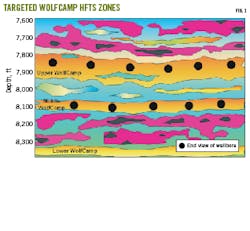
Production analysis from 11 wells at the Wolfcamp hydraulic fracture test site (HFTS) in the Permian basin showed higher water cuts from wells drilled into Middle Wolfcamp (MW) reservoir relative to wells drilled into Upper Wolfcamp reservoir (UW) (Fig. 1). Detailed log analyses indicate that the water came from a large transition zone extending into Lower Wolfcamp (LW). MW wells were drilled low in the zone with toe-up trajectories, exacerbating liquid load up and associated production problems. Drilling wells higher in the reservoir with toe-down trajectories could increase oil production and limit loading and well cycling.
UW, MW fracture systems
Previous production analysis on all wells defined drained rock volume (DRV) and recovery factors (RF) based on hydraulic fracture, core data, and long-term production data.1 Post frac whole core results indicated that UW had 2 times more fractures than MW, and proppant distribution was limited to less than 10% of vertical microseismic height due to bed boundaries and low viscosity frac fluid. Proppant was trapped where fractures intersect, limiting DRV.
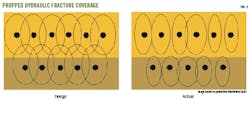
Although fracture density was high in UW, most hydraulic fractures had short half-lengths based on production interference testing. Even though some fractures had significant height growth well into the upper Spraberry layer, effective or propped heights were limited. In MW, natural fracture density was lower, fracture half lengths were longer based on more lateral communication during interference testing, and fracture height is more contained. Height growth containment came from previous in-well stages or nearby well stress shadowing interference and highly contrasting layer rock properties. Fig. 2 illustrates frac height and frac half-length ellipses for UW and MW wells.
Drained reservoir volumes in both UW and MW were generally low. A recovery factor (RF) of 7.4% was reported for well 6U. One root cause of the low recovery is lag between pressure transient and fluid migration to the well. For MW wells, another factor is high water cut.
Water production
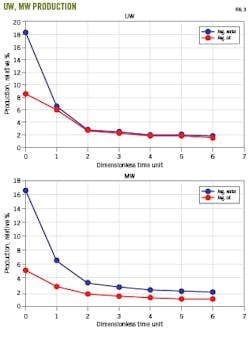
MW wells generally produced higher water cuts than UW wells during late-time production, leading to lower net oil and liquid-loading problems (Fig. 3). Initial water production was high in both UW and MW from hydraulic fracture water flowback, but water oil ratios (WOR) for MW wells persisted at twice the level as UW. Typically, WOR = 2 for MW wells and WOR = 1 for UW wells. Higher and mostly constant WOR observations support higher water saturation (Sw) from free water in MW.
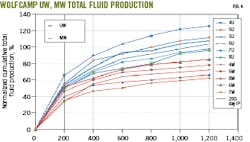
Fig. 4 shows 1,200-day normalized total production combining reported cumulative oil volumes and dynamic WOR over the producing period. Similar initial rates between UW and MW wells and fracture treatment quality analysis from previous studies suggest fracture treatments were not responsible for poor oil recovery in MW.
Log analysis
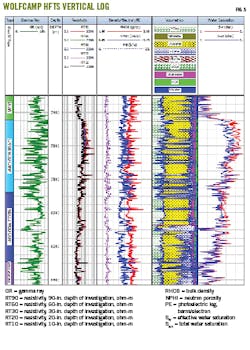
Log analysis indicates that MW sits within water sources in the reservoir. Petrophysical evaluations on vertical pilot-well wireline logs resolved UW and MW differences using gamma ray, density, neutron, induction resistivity, resistivity imager, dipole sonic, and pressurized core samples. Core samples calibrated the log interpretation model which included X-ray diffraction (XRD) and Gas Research Institute (GRI) porosity and permeability analysis.
Resistivity indicates increasing water moving from UW through MW and into LW (Fig. 5). This could be due to increased clay, however the lithology corrected computed Sw (last track in Fig. 5) shows a long transition interval with increased Sw starting at 7,500 ft MD and the LW indicting a water leg starting at 8,300 ft MD.
Probabilistic error minimization software modeled fluid and mineral volumes. Wireline logs were used as model inputs, and results are in the volumetrics and water saturation track. Calculated total water saturation (SwT) and Sw trend from low to high while moving deeper in the well, starting at around 7,440 ft. The higher Sw trend is also suggested by lower resistivity and large separation in input density and neutron logs.
Well trajectory
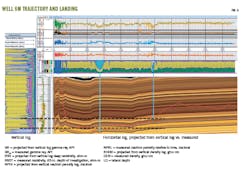
Based on log analysis, MW wells ideally should be completed high in the reservoir, away from water sources. Instead, 6M well trajectory shows the heel dipping low in the reservoir across water zones and into LW (Fig. 6). The vertical log is shown on the far left and the horizontal log is projected from the vertical log using measured well depth. Blue arrows indicate distinct carbonate markers and black dotted lines outline the MW target interval.
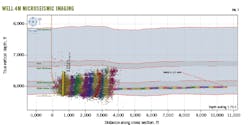
Geosteering correlation to the vertical offset-well closely matches measured gamma ray, density, neutron, and resistivity from 6M’s lateral open hole logs. The lateral traversed multiple benches and facies, with the toe half drilled in a higher bench of MW and the heel half drilled one interval below the lower bench. In addition to landing heels low in the reservoir, microseismic imaging shows downward fracture growth into LW (Fig. 7).
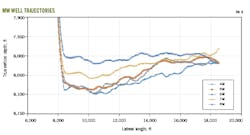
Other MW wells have similar trajectories (Fig. 8). Some are lower in the reservoir than others, but all except 8M have toe-up, J-shaped well paths which provide water traps detrimental to flow assurance. Well 8M has a low dip towards the heel which can act as a trap.
Gas depletion
Gas depletion in wells 5M, 4M, and 8M over a 20-30 month period reduced rates below critical velocity, leading to liquid load-up and well shut-in. Production restarted once BHP pressure increased, but the system was unstable, resulting in interruptions. Fig. 9 shows typical GOR and WOR trends under these conditions for well 8M.
Late-time load-up is observed in oscillations between low and high WOR starting at about 24 months. Gas depletion is observed by overall decreasing baseline GOR. By contrast, if the wells were toe down, water would be trapped at the bottom of the well, delaying shut-in or providing longer cycling periods. UW wells did not suffer from this condition because they had strong gas drive and lower WOR.
Improvements
Recommendations to improve performance at Wolfcamp include:
- Drilling infill wells to address low DRV and recovery factors instead of refracs which would suffer from frac height containment and short frac lengths characteristic of Wolfcamp completions.
- Drilling wells higher in MW to reduce water production.
- Drilling with toe-down wells to delay liquid load-up.
- Conducting squeezes with water shut-off chemicals in MW wells to retard water production.
- Running scab (solid insert) liners over exposed LW carbonate zones for remedial interventions in MW wells, such as water shutoff or refracs.
- Running NMR logs over MW on pad to address the long transitions zone and confirm free water volumes for optimized future well placement.
References
- Weijermars, R., Nandlal, K., Tugan, M.F., Dusterhoft, R., and Stegent, N., “Wolfcamp Hydraulic Fracture Test Site Drained Rock Volume and Recovery Factors Visualized by Scaled Complex Analysis Method (CAM): Emulating Multiple Data Sources (Production Rates, Water Cuts, Pressure Gauges, Flow Regime Changes, and b-Sigmoids),” URTeC-2434, Unconventional Resources Technology Conference, Austin Tex., July 20-22, 2020.
The authors
Ron Dusterhoft ([email protected]) is a technology fellow for Halliburton Energy Services (HES). He holds a BS (1984) in mechanical engineering from the University of Alberta and is an active member in the Society of Petroleum Engineers (SPE).
Neil Stegent ([email protected]) is a fracturing technology manager at HES. He holds a BS (1980) in agricultural engineering from Texas A&M University and is a lifetime member of SPE.
Nicholas Garrison ([email protected]) is a technical advisor at HES. He holds a BS (2012) in petroleum engineering from Texas A&M University. He is a member of SPE and Society of Petrophysicists and Well Log Analysts (SPWLA).
Robert H. (Bob) Gales ([email protected]) is chief geoscientist for formation and reservoir solutions at HES. He has a BS (1978) in math and physics from South Dakota State University. He is a lifetime member of SPWLA and SPE and served most recently as SPWLA-San Joaquin Well Logging Society president 2016-19.
