Study predicts viscosity of gas oils, heavy blends
A recent study used various gas oils and blends with residual heavy oils in order to evaluate the predictability of four different correlations. The gas oils differed substantially in their distillation range (T50 between 208° C. and 443° C.) and hydrocarbon composition (aromatics between 21% and 87%).
We found that one viscosity test at an arbitrary temperature and Singh’s correlation can predict a gas oil’s viscosity in the temperature range of 20-80° C. This correlation, along with that of the linear programming tool RPMS, can optimize the blending process during production of residual fuel oil in a refinery.
Correlations
Regardless of a worldwide trend towards higher-severity modes of operation in residue conversion units and decreased production of unconverted residual oils, refiners still need to blend them with lower-molecular-weight streams (cutter stocks) to meet viscosity specifications.
Typically, primary or secondary middle distillate fractions are used as cutter stocks. The addition of higher-value materials to unconverted residual oils from residue-conversion units requires optimization of the blending process—minimization of the amount of higher-value diluent—while still meeting fuel-oil specifications.
An earlier study showed that a model predicting fuel oil viscosity with information about viscosity of the residue and cutter stock, 50% distillation point, and density can optimize the blending process during production of residual fuel oil.1
Antonchenkov pointed out that the biggest difficulties occurred when during estimates of viscosity of residual and middle distillate fractions whose specifications are related to different temperatures.2 The residual fuel oil viscosity specification, for example, is related to a temperature of 80° C., whereas that of diesel oil is related to 20° C.
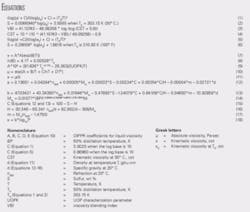
Singh, et al., developed a correlation that predicts viscosity of unrefined bitumen and heavy oils.3 Equations 1 and 2 in the attached equation box show Singh’s correlation.
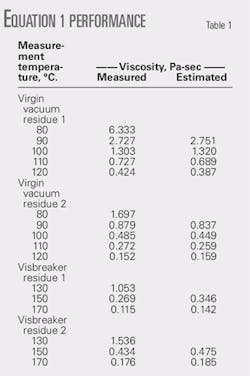
We tested this correlation using four residual heavy oils obtained from the Lukoil Neftochim Bulgaria (LNB) vacuum distillation and visbreaking units.
Table 1 shows measured and calculated values of the viscosity of the virgin vacuum residues and unconverted visbreaker vacuum residues. From these data and those reported in Reference 1, we concluded that Singh’s correlation for heavy oils predicts quite well the viscosity of virgin and secondary vacuum residual fractions at any temperature on the basis of one viscosity test at an arbitrary temperature.
These data also indicate that Singh’s correlation is valid not only for unrefined bitumen but also for refined residual oils.
Honeywell Process Solutions’ linear programming tool Refinery and Petrochemical Modeling System (RPMS) predicts the viscosity of blends of heavy oils and lower-molecular-weight oils using Equations 3 and 4.4
We tested this correlation in the LNB research laboratory using five blends containing mixtures of:
- Visbreaker residue.
- FCC light cycle oil (LCO).
- FCC heavy cycle oil (HCO).
- FCC slurry oil.
- Straight-run gas oil (SRGO).
- Atmospheric gas oil (AGO).
- Light vacuum gas oil (LVGO).
Table 2 shows the viscosities measured at 80° C. and estimated with the RPMS correlation. These data show that Equations 3 and 4 are accurate for predicting the viscosity of blends at 50° C. and also at 80° C.
We concluded that the prediction of viscosity of residual fuel oils needs only data of viscosity of the residue and cutter stocks at the temperature of the fuel-oil specification.
The aim of our study, therefore, was to investigate the different possibilities to predict viscosity of straight-run and secondary gas oils used as feasible cutter stocks.
Experimental
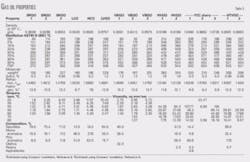
We investigated 16 gas oils from the atmospheric distillation, FCC, and visbreaker units in the LNB refinery. Table 3 shows the physical and chemical properties.
For this data set, we found that all viscosity-temperature dependencies obeyed the expression: log10 ν = –a*T + b. The correlation coefficient, r2, of this expression for all the studied gas oils was 0.99. Table 3 includes the values of coefficients a and b.
We measured the viscosity of all the gas oils according to ASTM-D 445. We analyzed the overall hydrocarbon composition of the middle distillates SRGO1, SRGO2 SRGO3, LCO, HCO, and LVGO according to EN 12916.
We analyzed the hydrocarbon composition of the middle distillates VBGO1, VBGO2, and VBGO3 according to ASTM D-1319 (FIA method). We used a method developed in the LNB research laboratory to analyze the hydrocarbon composition of the heavy gas oils: FCC slurry, HVGO, and HTVGO.5
The selection criteria for the gas oils in our study were based on the distillation range and hydrocarbon composition. Data in Table 3 indicate that the gas oils substantially differed in their distillation and hydrocarbon composition.
The 50% distillation point varied in the range 208° C. to 443° C., and the aromatics content varied from 21% to 87%. Olefins content varied between 0 vol % and 32 vol %.
This wide variation allowed us to determine the effect of the gas oil’s distillation (molecular weight) and chemical nature on the viscosity-temperature dependence.
Testing correlations
Our study tested these correlations:
- Equations 5 and 6. Kinematic viscosity correlation of Singh et al.6
- Equations 7-9. Correlation of Amin and Maddox as cited by Singh.6
- Equations 10 and 11. Correlation used in the software simulator ChemCAD.7 Viscosity is computed on the basis of the gas oil’s distillation properties and density.
- Equations 12-18 that predict parameters a and b for each gas oil investigated in this study (Table 3). We used Goossens’ correlations for molecular weight and hydrogen content.8 9
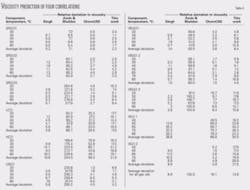
Table 4 shows the relative deviation between measured and calculated values using the four correlations. The relative deviation is different for all fractions and all correlations. All the correlations exhibited the highest relative deviation for the FCC slurry although there was a significant difference between the accuracy of the tested correlations.
Accuracy of the correlations was, in diminishing order: Singh’s correlation, regression, ChemCAD, correlation of Amin and Maddox.
Singh’s correlation is also the most appropriate because it requires only one viscosity test at an arbitrary temperature. This study used data of viscosity of the middle distillates at 20° C. and viscosity of heavy gas oils at 50° C.
The correlation of Amin and Maddox was not applicable to HVGOs.
References
- Stratiev, D., Belchev, Z., Petkov, P., and Kirilov, K., “A new correlation predicts viscosity of blends containing heavy residual oils,” Oil & Gas European Magazine, 2008, No. 1, pp. 31-33.
- Antonchenkov, V.P., “Oil viscosity estimation in a linear programming model,” Chem. Technol. Fuel Oils, 2005, No. 4, pp. 51-52
- Singh, B., Miadonye, A., and Putagunta, V.R., “Heavy oil viscosity range from one test,” Hydrocarbon Processing, August 1993, p. 157.
- RPMS 2000, Refinery and Petrochemical Modeling System, User’s Manual, Phoenix: Honeywell Process Solutions, 1999.
- Stratiev, D., Belchev, Z., Petkov, P., and Kirilov, K., “Investigation on residual fuel oil stability,” to be published in Oil & Gas European Magazine, No. 3, 2008.
- Singh, B., Mutyala, S., and Putagunta, V.R., “Viscosity range from one test,” Hydrocarbon Processing, September 1990, p. 39.
- ChemCAD User Guide, 1993, Chemstations Inc., Houston.
- Goossens, A.G., “Prediction of Molecular Weight of Petroleum Fractions,” Ind. Eng. Chem. Res., Vol. 35 (1996), No. 3, pp. 985-88.
- Goossens, A.G., “Prediction of the Hydrogen Content of Petroleum Fractions,” Ind. Eng. Chem. Res., Vol. 36 (1997), pp. 2500-04.
The authors
Dicho Stratiev ([email protected]) is an associate professor and chief process engineer for Lukoil Neftochim Bourgas, Bulgaria. He has held several positions in research and production activities during his 17 years with Lukoil Neftochim Bourgas. Stratiev holds an MS in chemical engineering and a PhD in oil refining from Bourgas University.
Rosen Dinkov is a chemical engineer in the oil refining group in the research department for Lukoil Neftochim Bourgas, Bulgaria. He works on crude oil characterization, fuel characterization, and modeling of refinery distillation processes. Dinkov holds an MS in organic chemistry engineering from Bourgas University.
Krasimir Petkov is manager of the technical and strategic development department for Lukoil Neftochim Bourgas, Bulgaria. He has held several positions in research, maintenance, and strategic planning during his 19 years with Lukoil Neftochim Bourgas. Petkov holds an MS in mechanical engineering from the Rouse technical university and a PhD from the Technical University in Varna, Bulgaria.
Kiril Kirilov is head of the oil refining group in the research department for Lukoil Neftochim Bourgas, Bulgaria. He has held several positions in research and strategic planning during his 19 years with Lukoil Neftochim Bourgas. Kirilov holds an MS in organic chemistry engineering from Bourgas University.
