Method estimates K values quickly
A new method to estimate equilibrium phase distribution ratios (K values) improves on the shortcomings of older methods. The method is based on the generalized fugacity charts of Lewis, Kay, and Newton, and uses reduced temperatures and pressures as parameters.
A third-degree polynomial is prepared from Lu’s chart for calculating liquid molarity, which is used for calculating liquid phase fugacity from fugacity of saturated liquid. The proposed method, therefore, requires looking up only one chart-the generalized fugacity chart (which is a well-spaced-out chart and can be read accurately) and the rest of the calculations use equations, thus enabling rapid calculation.
This article also explains the first principles for calculating K values from fugacity of real gases and liquids.
A K value is required whenever one designs a distillation column or assesses the performance of an operating column. Depriester nomographs can be used to obtain estimates of K values. The K values thus obtained depend on pressure and temperature of the multicomponent system and not on concentration.
Concentration-dependent K values can be calculated from empirical correlations involving lengthy calculations or from equations of state using commercial software because hand calculations are unwieldy. For preliminary design work and checking performance of existing columns, however, K values for multicomponent systems based on system pressure and temperature suffice.
Depriester nomographs do not explain the basis how the K values are obtained. Other methods require looking up charts or figures, where accuracy can be compromised.
K value
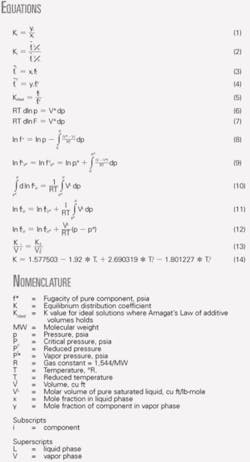
The equilibrium phase distribution ratio (K value) is defined in Equation 1 (see attached equation box).
For a system in equilibrium, TV = TL, PV = PL, andThe superscripts, V and L, indicate vapor and liquid phases, respectively, and the subscript i denotes a given component. The bar above f signifies value of fugacity in a mixture. An expression for Ki formulated in terms of the fugacity equality is Equation 2.
Combining Equations 2-4 gives the relationship in Equation 5 for ideal K values. fiL and fiV are the fugacities of component i in the pure liquid or vapor states at the system temperature and pressure. Kideal is a function of system temperature and pressure and independent of composition.
Pure vapor
For an ideal gas, Equation 6 holds true. For a nonideal gas, Equation 7 applies, in which fugacity is substituted for pressure.2
Subtracting Equation 6 from Equation 7 and integrating from p = 0 to p = p, and rearranging gives Equation 8. Setting f = p at p = 0 enables canceling the two indeterminate terms in the integration.
Pure liquid
The fugacity of a component in the liquid state is identical with its fugacity in the vapor with which the liquid is in equilibrium. A pure component is in equilibrium with its vapor only at a pressure equal to the vapor pressure of the liquid. Equation 9, therefore, shows fugacity for a pure liquid at a total pressure equal to its vapor pressure.2 The subscript p* on a fugacity denotes the fugacity at a pressure equal to the vapor pressure.
Equation 10 shows the basic definition of fugacity. Integrating the right hand side of Equation 10 and rearranging gives Equation 11.
Assuming VL to be independent of pressure over the range involved results in Equation 12.
Fugacities
f/P values for pure components have been found from generalized correlations of pressure-volume-temperature data.
Fig. 1 shows a generalized chart for f/P as a function of Tr and Pr1. The plot is a composite of the work of Lewis, Kay, and Newton. Values of f/P for the less-than-unity reduced isotherms were extended to higher than saturation pressure using some experimental vapor-liquid equilibrium data. In estimating vapor-liquid equilibria K values, Fig. 1 is applied to both phases.
Fig. 1 can be used to get the values of fiL and fiV in Equation 5. Knowing the pressure and temperature conditions of the vapor and its critical temperature and pressure, reduced conditions are computed. Values of f/P are found and fiV is found by multiplying by the pressure.
The graph may be used to calculate the fugacity of liquids at their vapor pressures because the fugacity of a pure component as a saturated vapor and saturated liquid are same at the same temperature and pressure. One can estimate the fugacity of a saturated liquid from the f/P chart by finding the corresponding vapor fugacity.
Liquid fugacities are obtained from the f/P chart using the method described at the vapor pressure at the given temperature. System pressure is higher or lower than the vapor pressures of the components in the mixture. One must consider the difference in pressure when computing the liquid fugacities of the components using Equation 11.
Vapor pressure
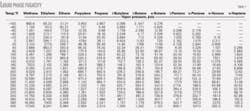
Vapor pressures are required for a wide range of temperatures when computing pure liquid fugacities. Some of the temperatures of interest are less than the boiling points of heavier hydrocarbons, while others are greater than the critical points of lighter components. Some vapor pressure values are available below the atmospheric boiling point, but extrapolation is required to get values of vapor pressure above the critical temperature.
The method we used to get values of vapor pressure for the new correlation is:
- Use API Research Project 44 vapor pressure values up to the atmospheric boiling point.
- Use a straight line on a log P vs. 1/T scales from the atmospheric boiling point through the critical point to get values above atmospheric boiling point. A straight line on a log P vs. 1/T graph gives a logical and a reproducible method of extrapolation to temperatures above the critical.
Table 1 shows the values of vapor pressure obtained in this way for 12 light hydrocarbons, proposed by Benedict in his empirical correlations.3
Liquid fugacity
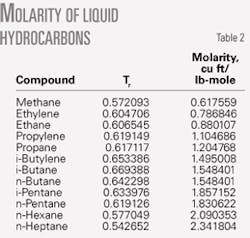
Computing pure liquid fugacity from Equation 12 requires estimation of VL, the molar volume of pure saturated liquid. If the critical values Tc and Pc are known, Lu’s generalized chart (Fig. 3.51 in reference 4) should be used for molar volume estimations.4
Lu’s chart is a plot of Tr vs. K with Pr as a parameter. If the value of V1L at Tr1 is known, K1 is read from the saturated line on the chart. If Tr2 is the reduced temperature corresponding to the system temperature, K2 is read from the chart, and V2L is calculated using Equation 13.
Table 2 shows data for V1L at Tr1 for 12 light hydrocarbons, based on known temperatures. For ease of computing and to avoid looking up Lu’s chart, we fit the saturated liquid line of Lu’s chart into a third-order polynomial, shown in Equation 14.5 The calculated K from this polynomial is within 1% of the saturated liquid line in Lu’s chart.
Kideal values calculated with the new method can be used as the first approximation for equilibrium stage calculations for light hydrocarbons.
Example 1
Estimate K value for propane at 100° F. and 300 psia given:
- Tc = 666° R.
- Pc = 617 psia.
- P* (from Table 1) = 190.3 psia.
- MW = 44.
- Molar volume of liquid (from Table 2) = 1.204768 cu ft/lb-mol at Tr = 0.6171
By definition, Tr = (100 + 460)/666 = 0.8408 and Pr = 300/617 = 0.4862.
Pr* is therefore 190.3/617 = 0.3048. f/P from Fig. 1 is 0.692 for Tr = 0.8408 and Pr = 0.4862. fiV is therefore 0.692*300 = 207.6 psia.
f/P from Fig. 1 is 0.8 for Tr = 0.8408 and Pr* = 0.3048. Multiplying by P* gives fiLP* = 0.8*190.3 = 152.24 psia.
Using Equation 14 and Tr = 0.6171, then K1 = 0.9938907. Similarly, for Tr = 0.8408, K2 = 0.7949121.
Rearranging Equation 13 gives V2L = (K2/ K1)* V1L = (0.7949121/0.9938907)*1.204768 = 0.963571.
From Equation 12, ln fiLp = ln 152.24 + ((0.963571*44)/(1,544*560))*(300-190.3) = 5.030837. Solving for fiLp gives a value of 153.0611.
Using Equation 5, Kideal = fiL / fiV = 153.0611/207.6 = 0.737289.
Example 2
Estimate the K value for ethane at 120° F. and 400 psia given:
- Tc = 550° R.
- Pc = 708 psia.
- P* (from Table 1) = 963.8 psia.
- MW = 30.
- Molar volume of liquid (from Table 2) = 0.880107 cu ft /lb-mol at Tr = 0.606545.
By definition, Tr = (120 + 460)/550 = 1.0545 and Pr = 400/708 = 0.5650. Pr* is therefore 963.8/708 = 1.3613.
f/P from Fig. 1 is 0.83 for Tr = 1.0545 and Pr = 0.5650. fiV is therefore 0.83*400 = 332 psia.
f/P from Fig. 1 is 0.59 for Tr = 1.0545 and Pr* = 1.3613. Multiplying by P* gives fiLP* = 0.59*963.8 = 568.642 psia.
Using Equation 14 and Tr = 0.606545, K1 = 1.00076. Similarly, for Tr = 1.0545, K2 = 0.4323483.
Using Equation 13 gives V2L = (K2/K1)* V1L = (0.4323483/1.00076)* 0.880107 = 0.351778.
From Equation 12, ln fiLp = ln 568.642 + ((0.3802283*30)/(1,544*580))* (400 - 963.8) = 6.33606956. fiLp is therefore = 564.572923.
Using Equation 5 gives Kideal = fiL/fiV = 564.572923/332 = 1.70052085.
References
- Edmister, W.C., “Applied Hydrocarbon Thermodynamics, Part 18,” Petroleum Refiner, June 1960.
- Smith, B.D., “Design of Equilibrium Stage Processes,” New York: McGraw-Hill Book Co. Inc., 1963.
- Edmister, W.C., “Applied Hydrocarbon Thermodynamics, Part 19,” Petroleum Refiner, July 1960.
- Perry, J.H., et al.,“Chemical Engineers’ Handbook,” 4th Ed., New York: McGraw-Hill Book Co., 1963.
- King, E.P., “Curve Fitting-Quick and Easy,” Hydrocarbon Processing & Petroleum Refiner, July 1962.
The author
S.K. Mukherjee (skmukherjee @hpcl.co.in) is an executive director for safety, health & environment at Hindustan Petroleum Corp. Ltd., Mumbai, India.


