Revamp, troubleshooting optimize NGL depropanizer operations
The operator of a high-pressure depropanizer removed the high-performance packing and installed high-capacity trays to improve operations and fractionation. The Michigan plant saved an estimated $350,000/year due to the revamp and subsequent troubleshooting.
The high-pressure depropanizer, operating at 195 psig, was originally filled with a popular 1 in., high-performance random packing. At yearend 1998, the plant owner decided to revamp the tower due to poor operations. Fractionation and heat input per barrel of feed were deemed unacceptable.
Operating data indicated the usefulness of revamping the tower with Superfrac trays, which took place in early 2000 over 9 days, blind-to-blind. The tower internals portion of the plant revamp was finished 2 days ahead of schedule.
The revamp to high-capacity trays provided a 6-month payback advantage vs. replacing the random packing in-kind. The trays decreased steam requirements due to more stripping stages.
The need to revamp
Operators in the refining and chemical industries want to maximize the net value of fixed plant assets. Strategies include maximizing the capacity and operating efficiency of reactors, distillation towers, conversion units, and peripheral equipment. The operating envelopes of distillation towers and internals, therefore, are pushed to new limits.
Distillation industry companies have developed products to attain the limits requested by refinery and chemical plant operators.
The industry workhorse for a long time was the bubble-cap tray. The moveable valve and sieve tray became more popular than bubble-cap trays when higher capacities were needed.
As the capacity envelope was expanded, operators started using structured and random packing. Owners tended to install packing in every tower that needed additional capacity.
Engineering personnel would apply random and structured packing even into high-pressure systems. As with any new technology, however, it took several attempts and failures to understand that packing is not the cure-all for some underperforming towers.
Depropanizer
In 1986, the plant owner decided to revamp an old debutanizer to depropanizing service to increase capacity.
Based on an engineering company's recommendation, the owner removed 12 conventional valve trays in the stripping section. They were replaced with one 21 ft, 9-in. high bed of random packing with supports and a high-efficiency liquid distributor. The revamp's purpose was more operating capacity without a loss in efficiency.
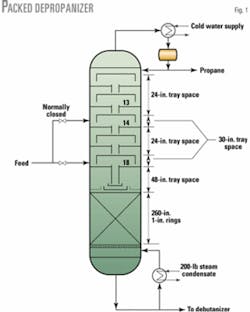
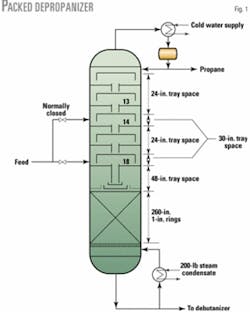
Fig. 1 shows the tower's packing layout. The tower was fitted with two feed locations, the lower of which was intended for postrevamp operations.
After the revamp, the operators learned that the upper feed point was more optimal, based on the least amount of steam input per barrel of feed. This indicated that the tower's bottom section was underperforming vs. design standards.
During a 1999 performance test run, operators moved the feed to the upper point, which caused reboiler steam use to drop 5% at the same separation profile.
The only drawback to this operation in the long term was that trays between the upper and lower feeds were designed as rectification section trays and not stripping section trays. Their downcomer capacity, therefore, was much lower than what was required to operate at maximum rates.
At high rates they would experience downcomer flooding and limit tower capacity. The operator had to lower the feed to less-than-design rates to prevent flooding.
The stripping section generated 8-9 theoretical stages. Because the stripping section was fitted with 21 ft of 1 in., high-performance random packing, the calculated height equivalent to a theoretical plate (HETP) was around 28-32 in. of packing/stage of separation. This poor performance produced a large operating debit in the tower.
Before the 2000 revamp, we performed a test to gain a firm tower design basis. We took field-measured temperatures, pressures, and samples during the performance test. Based on these data, we analyzed the present and future tower operations.
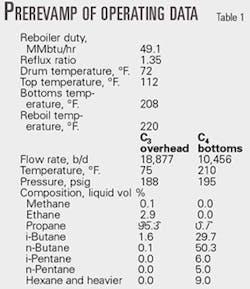
Table 1 shows the prerevamp test run data that we collected during maximum operating rates.
Tower revamp
Due to underperforming packing, the plant owner approved a revamp to replace the packing. The owner believed that damaged, possibly plugged, or dislodged packing caused the operational problems.
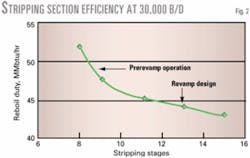
Based on the performance test, we recommended a more aggressive revamp that would have a large operational payback. Operating data showed that the stripping section was operating at an inflection point in the stripping stages vs. reboil curve (Fig. 2). This confirmed that the packed tower was sensitive to stripping stages.
The stage vs. reboil or reflux graph is helpful when one analyzes tower operations or creates a revamp strategy. Many high-pressure tower revamps that address efficiency-dependent systems fail due to an efficiency decrease when revamping to packing from trays.
This graphical device helped optimize tower operations. Steam use for the reboiler was most of the tower's operating expense. In the 2000 revamp, the trays were installed with tight spacings to maximize overall stripping section efficiency. Maximizing number of stages per foot of tower height is critical for minimizing reboiler duty.
Maximizing the stage parameter was critical in this circumstance. One can use the stage parameter to calculate the effectiveness of a tray device. In simple terms, effectiveness is the tray spacing divided by observed tray efficiency. This is comparable to HETP in packing terminology.
We used the stage parameter to compare two tray options at different tray spacings and efficiencies:
Option 1: 16-in. spacing at 90% efficiency.
Option 2: 14-in. spacing at 70% efficiency.
Option 1 had a stage parameter of 17.8 in. and Option 2 was 20.0 in. Option 1 was therefore the better tray arrangement. For a tower with 200 operating stages, this could result in a savings of 33 ft.
For a revamp situation, this would increase the number of stages, thereby improving energy efficiency, reduce reflux, and possibly increasing unit capacity. This is an important revamp tool for towers that are operating in a highly stage-dependant section of the reboil vs. stage curve. This is discussed in detail in the literature.1
For this particular revamp, we exploited the shape of the stage vs. reboil curve to reduce stripping steam use. The high capacity, high-efficiency trays allowed the owner to maximize stripping stages.
In Fig. 2, because the separation has such a vertical curve less than 9-10 stages, any gain in stripping stages in this portion of the curve leads to a huge reduction in steam use and ultimate tower capacity.
Ultimate tower hydraulic capacity consists of two terms: tower feed vapor and liquid, and the required reboil and reflux to gain the separation.
Typically, design feed rates are fixed. Reducing the second parameter is only possible by changing the number of separation stages. In this revamp, we could increase the number of stripping stages to improve energy efficiency.
Random-packing performance
A few companies use random packing for high-pressure applications. Random packing frequently suffers from a loss of HETP in high-pressure systems.
Based on the field tests, we calculated the number of theoretical stages using a simulation that matched plant data and using a McCabe-Thiele analysis. Both methods showed that the packing generated 8-9 theoretical stages.
Based on a basic HETP analysis, the packing showed an HETP of 28-32 in. The stage parameter for the tray option was around 19-20 in.
The distributor installed with the random packing was a high-efficiency riser plate distributor. Special features included elongated tubes to usher liquid from the plate to the packing and a trough to mix rectification-section liquid with feed liquid. The distributor had a distribution quality of 8.5 drips/sq ft.
Packing in high-pressure applications, not necessarily absorption-contacting or heat transfer, has not been very successful. This is especially true for columns other than demethanizers and columns that are sensitive to temperature levels or pressure drops. Table 2 shows case examples of high-pressure random packing testing compared with this depropanizer prerevamp operation.
The HETP for random packings operating at 150-250 psig is sensitive to vapor loadings.
The poor performance of the 1-in. packing resulted from the specific type of packing in this large column, the quantity of vapor backmixing, distributor design, and the size of the column used for testing. High-pressure distillation columns should not use random or structured packing. This is especially true when tight separations are required.
2000 tower revamp
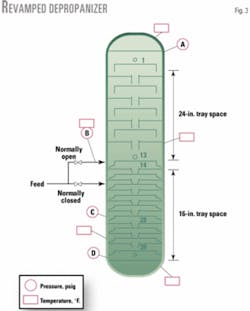
In 2000, the tower was revamped from packing to trays. Fig. 3 shows the revamped tower schematic.
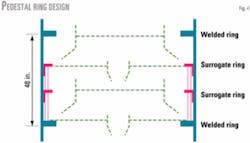
New surrogate ring design
When the tower was fitted with random packing, tray rings in the packed zone were removed. The only tray rings that remained were used to support the distributor and packed bed support. Additional weld-in rings were therefore required to support the new trays.
Early in the design, we wanted to know the minimum number of tray rings that had to be welded to the tower shell to support the 25 new trays. A new tray ring at each tray location would have required 25 new tray rings, which would have resulted in excessive field work and an unacceptable schedule.
Many revamps use single surrogate pedestal rings that support two trays from a single weld-in ring.1 5 6 We considered a solution that would have needed 13 new tray support rings and an unacceptable amount of downtime.
To minimize installation time, we decided to support three trays from a single weld-in ring. This would require only eight new tray support rings.
Fig. 4 shows a schematic for this revamp strategy.
To minimize work even further, we considered each weld-in ring for more than three trays. Further in-depth analysis showed that the limit is 8-12 trays supported by one weld-in ring. For a new tower, reducing the number of weld-in rings would produce significant manufacturing savings.
The revamp procedure was uneventful. The packing material showed no fouling or scale that could have explained the inefficiency. The total revamp window for the new trays and internals required 9 days blind-to-blind and came in 2 days ahead of schedule.
Performance testing
The maximum guarantee point for the tower revamp was a raw feed rate of 30,500 b/d. At this rate, the tower was guaranteed to meet certain fractionation goals. Due to feedstock shortages in 2000, the tower was operating at lower-than-guaranteed feed rates.
Later in 2000, we tested the tower to validate the guarantee. The plan was to increase feed to 31,000 b/d from 25,000 b/d to validate the maximum capacity guarantee. The tower reached a feed rate of 27,500 b/d and operated there for an extended period. At feed rates greater than 28,000 b/d, the tower would start flooding.
Premature flooding
Two tower readings highlighted the problem area: the top section pressure drop and the top section temperature profile. During flooding, the rectification section's pressure drop increased 1-1.5 psi, and the rectification section's temperature profile shifted; this indicated the onset of flooding.
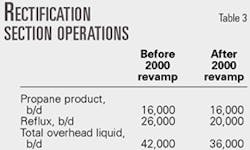
Table 3 summarizes the rectification section's loadings.
A material balance around the rectification section showed that it had lower loadings than before the 2000 tray revamp. Reflux was approximately 15% lower than before the 2000 revamp with a constant distillate.
Because the rectification trays were not modified during the shutdown, we believed that they were not the problem. A quick capacity estimate showed that the rectification trays were operating at around 50% of downcomer capacity and at a pressure drop of 0.065 psi/tray, which is far below flood. For the trays to be the problem, one would have to prove that the trays were damaged because they were not tunneled during the revamp.
In this case, the tower's rectification section would flood when the tower capacity increased. Flooding was independent of how the rectification section loaded: via increased feed preheat or increased feed rate.
During flooding episodes, the tower would never lose bottoms liquid level nor would the stripping section lose stripping efficiency. An increase in reboil duty per barrel of feed would indicate a loss in stripping efficiency. This never occurred.
We conducted detailed pressure and temperature surveys to troubleshoot the column. Tower pressure drops were taken through some of the older valves.
Fig. 3 shows some of the pressure measurement locations.
Field troubleshooting focused on finding the cause of the lower-than-expected tower capacity. We tested the tower at feed rates lower than flooding capacities and then increased feed rate to find the limitations. The feed zone was limiting the tower's capacity.
These facts indicated that the limitation was the feed zone:
Tray 12 temperature would increase. This could only result from: stripping section flooding, entrainment or backup from the feed zone, or rectification section flooding. Based on temperature and pressure measurements, we concluded that the stripping section did not flood during normal operations. This indicated that the problem was either in the feed zone or rectification section.
During the onset of flood, the C3 product would lose purity. At constant reflux, a purity decrease could result from rectification section flooding or increased reboil at a higher reflux ratio. Reboiler steam use was constant during the testing, which indicated that the rectification section was limiting.
After a feed rate increase to 29,000 b/d, we took data at three times (Table 4). These measurements used separate gauges; therefore the relative difference between subsequent measurements is important. The feed rate was increased 9:45-10:00 a.m.
The only pressure drop that increased measurably during testing was in the rectification section. The entire tower pressure drop increased 1.7 psi, and the top-to-feed and top-to-Tray 22 increased 2.1 psi and 1.9 psi, respectively.
These increases, combined with the fact that the lower section's pressure drop did not increase measurably, indicated that the hydraulic limitation was above Tray 22.
Columns flood in different ways.1 Isolating and plotting the tower pressure drop during a flooding episode help identify the flooding mechanism.
Jet flooding and downcomer backup flood happen over an extended time frame and are typically subtle. Downcomer choke flood happens abruptly and is typically characterized by a sudden and steep pressure drop increase across the tower.
Based on the differential pressure measurement increase from normal (9:35 a.m.) to the flooded state (3:00 p.m.) for the top-to-Tray 22 of 1.9 psi, the height of liquid equivalent is 9.75 ft of liquid at a density of 28.5 lb/cu ft.
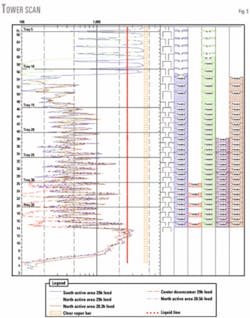
A tower scan showed that the rectification section was flooded from below Tray 9 to Tray 13. Flooding in this zone equates to around 10 ft of liquid equivalent.
All the data indicated that the tower limit was above Tray 22. The fact that the tower never lost bottoms level and that Tray 37 temperature controller never lost profile confirmed this finding.
Tower scans
Tower scanning allows a troubleshooter to gather information on a nonperforming tower; however, the troubleshooter should always begin with the plant data. Scans are subject to interpretation, and can lead the troubleshooter away from the problem.
Fig. 5 shows scans for the depropanizer, which revealed several problem areas:
- Bottoms liquid level was close to the reboiler return.
- Trays below the feed had high froth heights and were close to flood.
- The feed zone never reached the "clear vapor" line. Even the trays above the feed zone on 24-in. tray spacing cleared up. This was unexpected because the feed zone was 36-in. high.
These theories were each ruled out when we attempted to find the problem area. Pressure-drop readings at the reboiler inlet confirmed the bottoms liquid height. This reading, along with additional and focused scans, confirmed that the liquid level was not the problem causing lower-than-expected capacity.
Interpreting scans of high-pressure columns operating in a froth regime is more difficult than for a tower operating at atmospheric or vacuum conditions. These factors can influence a scan's interpretation:
- Tray spacing.
- Number of readings taken between trays.
- Tray design.
In this case, interpreting the scan was difficult. Due to a complicated 2000 revamp tray design support mechanism, the scan absorption was not constant between trays.
The tray surrogate rings, for instance, extended approximately 3.5 in. below the tray deck, or about 21% of the tray spacing. Because the scan density was about 2 in./reading, the two readings immediately below a tray were not accurate.
The downcomer design included multiple spreader plates inside the downcomer that had slots. These spreaders interfered with the downcomer scans and hampered interpretation of downcomer backup.
Diagnosing a tower solely based on a tower scan is risky because scan results can be deceiving. Troubleshooting involves systematic elimination of possibilities. In this case, pressure drop measurements and the feed zone scan indicated a problem in the feed zone.
Based on these two facts, we reviewed the feed zone in depth.
Feed zone review
There are many guidelines regarding feed pipe design.7 8 The feed pipe design in the tower met or exceeded recommended guidelines for intermediate feed-zone design.
Parameters for two-phase feed design include a pipe-to-tray spacing with 66% below and 33% above the pipe, 12-in. minimum elevation of pipe above tray, and additional tray spacing at the feed zone.
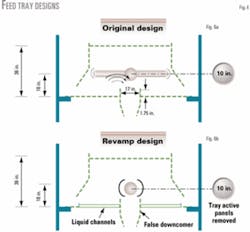
Fig. 6A shows a schematic of the feed zone.
In this case, the feed-zone design caused the tower to flood prematurely.
The primary contribution of feed-zone failure was that the main feed pipe interfered with liquid and froth flowing into the downcomer. Even though the calculated entry area was 125% of total top downcomer area, the tortuous path of froth into the downcomer was enough to cause the feed tray to flood.
To confirm that the feed tray was building up liquid, we conceived a test that would compare measured column pressure drop to the liquid stackup on the feed tray. If the feed tray liquid stacked up before the tower pressure drop increased, we could isolate the problem to the feed tray.
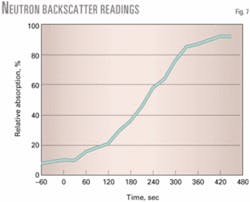
We used neutron backscatter testing to measure liquid stackup on the top stripping section tray. This technique detects differences in hydrogen concentration to measure respective interface levels. Vapor has a low reading and liquid has a high reading.
The technique is used for close-to-the-shell measurements, usually 2-3 in. immediately inside the column shell. Tru-Tec Services describe this method.9
Using neutron backscatter testing, we set up a time study to measure the absorption of liquid, vapor, or froth 15 in. above the feed tray. We calibrated the measurement with clear liquid in the downcomer (100%, liquid) and vapor immediately under Tray 13 (0%, clear vapor).
Fig. 7 shows results from the neutron backscatter study.
At 0 sec, feed was increased. Within 120 sec, the feed rate increase started showing up in liquid stack-up. The pressure drop did not increase more than 0.1 psi until 205 sec. This confirmed that the feed-zone backup caused the pressure drop increase and flooding that propagated to the rectification section.
We eliminated the interactions by:
- Adding seal pans to Tray 13.
- Removing the active panels for Tray 14 while leaving the central downcomer in place.
- Routing liquid from the Tray 13 seal pan to the Tray 14 false downcomer.
- Revising the feed pipe design to feed the Tray 14 false downcomer.
Fig. 6B shows these design changes.
During this revamp change, we revised the seal pans below Tray 39 to eliminate possible interactions with the reboiler return.
Superfrac operations
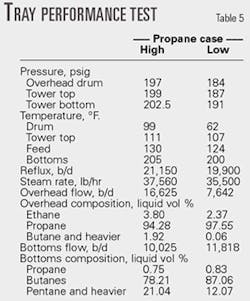
After the revamp changes, the Superfrac trays were operated at 103% of design loadings. Due to the NGL situation in the US Northeast, the plant is operating intermittently and with a different propane feed content compared to the original design.
The tower was recently tested at 19,500 b/d with a feed propane content of only 38%. The design propane feed content was 58%.
To test the tower bottom's capacity, the plant operator increased C3 purity and recovery. C3 purity increased to 97.5% from 94.5%.
Table 5 shows the current column operations. The tower operates differently than what it was designed for, but the internal loadings are comparable to the design rates.
Acknowledgments
The authors thank J. Kolek at Tru-Tec Services for the scans and backscatter results and Veada Colic at Process Consulting Services for her mechanical work on this project. F
References
1.Hanson, D.W., and Hartman, E.L., "High Capacity Distillation Revamps," Petroleum Technology Quarterly, Autumn 2001, pp. 53-59.
2.Kister, H., Chellappan, S., and Spivey, C., "Debottleneck and Performance of a Packed Demethanizer," Proceedings of the 4th Ethylene Producers Conference, AIChE, New York, 1992.
3.Kunesh, J., and Shariat, A. "Packing Efficiency Testing on a Commercial Scale with Good Reflux Distribution," Proceedings of the 1993 Spring National Meeting, AIChE, New York, 1993.
4.Nutter, D, Silvey, F., and Stober, B., "Random Packing Performance in Light Ends Distillation," IChemE Symposium Series No. 128, IChemE, London, 1992, pp. A99-107.
5.Urbanski, N., Heldwein, T., Miller, R., and Kerlin, M., "Minimizing the Time and Cost of Tray Installation," Proceedings of the 2001 Spring National Meeting, AIChE, New York, 2001.
6.Resetarits, M., and Miller, R., "Increase demethanizer efficiency and capacity," Hydrocarbon Processing, October 1991, pp. 79-81.
7."17 Critical Questions and Answers About Trays, Column Internals, and Accessories," Bulletin 674, Glitsch Inc., Dallas, 1988.
8.Kister, H., "Distillation Operation," McGraw-Hill Co., New York, 1990.
9."Tru-Tec Process Diagnostic Services Neutron Backscatter Applications," Tru-Tec Services, La Porte, Tex., 1998.
The authors
Daryl W. Hanson is a chemical engineer with Process Consulting Services, Houston. His experience includes lead process specialist for Koch-Glitsch Inc., Dallas, where he was involved in more than 100 column revamps including heavy oils and light-ends recovery. Hanson holds a BS in chemical engineering from Texas A&M University.
Ian Buttridge is a cheical engineer at Koch-Glitsch LP, Dallas. He serves the Asia-Pacific market. His responsibilities include revamp projects for the refining and petrochemical industries. He previously worked for Glitsch Inc. Buttridge holds a BS in chemical engineering from Texas A&M University.
