2013 ethylene output rises; growth to continue in early 2014
Dan Lippe
Petral Consulting Co.
Houston
US ethylene producers will complete four incremental expansions and continue to increase ethane-based production capacity in 2014. These projects will increase capacity by 2.8 billion lb/year.
These producers completed two incremental expansions, adding a total of about 0.5 billion lb/year in first-half 2013. A fire and explosion at Williams Olefins LLC's ethylene plant in Geismar on Jun. 11, 2013, however, reduced operable capacity by 1.3 billion lb/year (OGJ Online, Jun. 13, 2013).
Despite the Geismar outage, ethylene producers had less capacity out of service for planned turnarounds and were able to run at higher operating rates during second-half 2013. The increase in production was enough to offset the loss of ethylene supply from Geismar.
The increase in ethylene production capacity based on ethane in first-half 2014 will require less production from higher cost feeds. The continued shift to ethane as primary ethylene feedstock will result in a further reduction in coproduct propylene supply.
Petral Consulting Co. surveys ethylene producers monthly to determine industry operating rates and demand for fresh feed. All volumes presented in the following discussion of olefin-plant feedstock trends as well as in the later discussion of ethylene production trends are based on results of this survey.
Feedslate trends
Ethylene industry demand for fresh feed was 1.69 million b/d in third-quarter 2013 and declined to 1.66 million b/d the following quarter. Demand for fresh feed in third-quarter 2013 was 63,600 b/d (3.9%) more than in third-quarter 2012 and was 58,000 b/d (3.6%) more than in fourth-quarter 2012. The increase in demand for fresh feed was consistent with year-to-year increases in ethylene production in second-half 2013.
Demand for LPG feeds (ethane, propane, and normal butane) averaged 1.52 million b/d in third-quarter 2013 but declined to 1.51 million b/d the following quarter. Demand for LPG feed in third-quarter 2013 was 94,300 b/d (6.6%) more than in third-quarter 2012 and 81,000 b/d (5.7%) more than in fourth-quarter 2012. Finally, LPG feeds accounted for 90-91% of fresh feed in third and fourth quarters 2013.
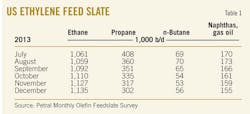
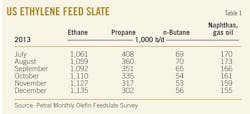
Economics for ethane vs. heavier feeds remained consistently favorable during second-half 2013. Ethylene producers continued to increase their use of LPG feeds and further reduced their use of heavy feeds. Ethane's share of total fresh feed was 64.6% in third-quarter 2013 and 66% in fourth-quarter 2013 vs. 62% in second-half 2012. Table 1 summarizes trends in olefin plant fresh feed.
Petral Consulting forecasts that production from US ethylene plants will improve in first-half 2014 and the industry will operate at 88-90% of nameplate capacity during the period.
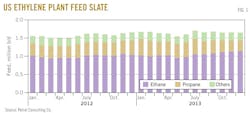
Petral Consulting also forecasts that demand for fresh feed will average 1.60-1.65 million b/d during first and second quarters 2014. Based on this forecast, demand for LPG feeds will average 1.43-1.45 million b/d during those 6 months. Fig. 1 shows historic trends in ethylene feed.
US ethylene production
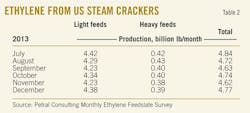
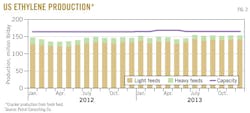
Ethylene production from olefin plants averaged 154.2 million lb/day in third-quarter 2013 and 153.6 million lb/day in fourth quarter. Total ethylene production in third-quarter 2013 was 571 million lb (4.2%) more than in third-quarter 2012; production in fourth-quarter 2013 was 620 million lb (4.6%) more than in fourth-quarter 2012.
In third-quarter 2013, only one plant was out of service due to a scheduled turnaround, which Petral Consulting estimates resulted in 200 million lb of lost production. A few plants experienced downtime for unplanned maintenance, yielding estimated production losses of 160 million lb. In fourth-quarter 2013, the industry had no scheduled turnarounds, but unplanned downtime in those 3 months, Petral Consulting estimates, resulted in an additional production loss of 50 million lb.
Production from light feeds in third-quarter 2013 averaged 140.6 million lb/day and edged up in fourth quarter to 140.8 million lb/day. Production from light feeds in third-quarter 2013 was 775 million lb (6.4%) more than in third-quarter 2012. Production from light feeds in fourth-quarter 2013 was 763 million lb (6.3%) more than in fourth-quarter 2012.
Ethylene production from heavy feeds averaged 13.6 million lb/day in third-quarter 2013 and declined to 12.8 million lb/day the following quarter. Production from heavy feeds in third-quarter 2013 was 206 million lb (14.2%) less than in third-quarter 2012. Production in fourth-quarter 2013 was 142 million lb (10.8%) less than in the quarter a year earlier.
Table 2 summarizes trends in ethylene production.
Ethylene production from heavy feeds accounted for 10-12% in 2012 but declined to 8-10% in 2013. Most likely, production from heavy feeds will account for 8-10% of total ethylene production in first-half 2014.
Fig. 2 shows trends in ethylene production.
US propylene production
Coproduct propylene supply depends primarily on the use of propane, normal butane, and naphtha and other heavy feeds with a large propylene yield. Petral Consulting's monthly survey of ethylene producers showed demand in third-quarter 2013 was 373,100 b/d for propane, 71,800 b/d for normal butane, and 170,000 b/d for heavy feeds. In the following quarter, demand was 318,000 b/d for propane, 64,100 b/d for normal butane, and 158,100 b/d for heavy feeds.
Total demand for feeds with high propylene yield was 615,000 b/d in third-quarter 2013 and was 22,500 b/d (3.8%) more than in third-quarter 2012. Total demand for these feeds in fourth-quarter 2013 was 540,100 b/d and was 22,600 b/d (4.0%) less than in the year-earlier quarter.
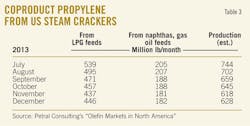
Coproduct supply (based on estimates derived from the monthly production and feedstock survey) increased in third-quarter 2013 but declined in fourth quarter. Production averaged 22.9 million lb/day in third-quarter 2013 and 20.6 million lb/day in fourth quarter.
Propylene production from light feeds averaged 16.4 million lb/day in third-quarter 2013 and 14.6 million lb/day in the following quarter.
The year-to-year increases in demand for propane and normal butane supported increases in coproduct propylene supply from light feeds in third-quarter 2013. Demand for propane in third-quarter 2013 was 15,800 b/d (4.4%) more than in third-quarter 2012, while demand for normal butane in third-quarter 2013 was 37,400 b/d (108%) more than in third-quarter 2012. In fourth-quarter 2013, coproduct supply declined amid reduced demand for propane but steady demand for other high-yield feeds.
Propylene production from heavy feeds increased in third-quarter 2013 from second-quarter 2013 but declined in fourth quarter. Coproduct propylene from heavy feeds averaged 6.5 million lb/day in third-quarter 2013 and 6.0 million lb/day in the following quarter. Production from heavy feeds in third-quarter 2013 was 98 million lb (14%) less than in third-quarter 2012.
Table 3 summarizes trends in coproduct propylene supply.
PDH plant, refineries
According to PetroChem Wire, Petrologistics' propane dehydrogenation (PDH) plant on the Houston Ship Channel operated at capacity in third-quarter 2013 but experienced downtime for a scheduled turnaround in October.
As a result, Petral Consulting estimates the plant produced 3.6-3.8 million lb/day in third-quarter 2013 and 2.6-2.8 million lb/day in fourth quarter. Production in second-half 2013 was 0.06 million lb/day (1.9%) more than in second-half 2012.
Refinery propylene sales into the merchant market are a function of feed rates in refinery fluid catalytic cracking units (FCCUs), operating severity in FCCUs, and economic incentives to sell propylene rather than use it as alkylate feed. Variations in FCCU feed rates are the most important parameter, while economic factors are generally of secondary importance.
Statistics from the US Energy Information Administration (EIA; www.eia.gov) show FCCU feed rates averaged 5.08 million b/d in third-quarter 2013 and fell to 5.0 million b/d in fourth quarter. FCCU feed rates in third-quarter 2013 were 56,000 b/d (1.1%) more than in third-quarter 2012; feed rates in fourth-quarter 2013 were 7,500 b/d (0.2%) more than a year earlier.
FCCU feed rates in US Petroleum Administration for Defense Districts (PADDs) 2 and 3 are more important than broader US trends because refineries in these two regions usually account for 90-95% of refinery-grade propylene. (See accompanying box for PADD regions.)
FCCU feed rates in PADDs 2 and 3 in third-quarter 2013 were 72,700 b/d (2%) more than in third-quarter 2012. FCCU feed rates in PADDs 2 and 3 in fourth-quarter 2013 were 32,900 b/d (0.9%) more than a year earlier.
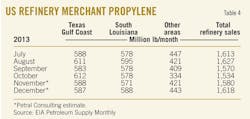
EIA statistics show that refinery-grade propylene production averaged 52.2 million lb/day in third-quarter 2013 and 52.0 million lb/day in the following quarter. Production in third-quarter 2013 was 349 million lb (7.8%) more than in third-quarter 2012. Production in fourth-quarter 2013 was 120-130 million lb (2.7%) more than in fourth-quarter 2012 (Table 4).
Based on EIA statistics for refinery-grade propylene and Petral Consulting's estimates for coproduct supply, total US propylene supply increased in third-quarter 2013, averaging 75.2 million lb/day. Production was 4.4 million lb/day (6.3%) more than in third-quarter 2012.
US propylene supply declined in fourth-quarter 2013, averaging 71.9 million lb/day. Although production in fourth-quarter 2013 was less than in third quarter, it was 1.3 million lb/day (1.8%) more than in fourth-quarter 2012.
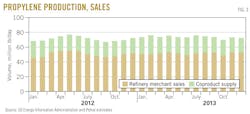
Fig. 3 presents trends in coproduct and refinery-propylene sales, as reported by EIA.
Ethylene economics, pricing
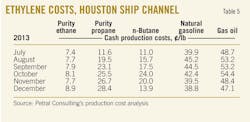
Production costs for ethylene on the Houston Ship Channel (assuming full spot prices for all coproducts) based on purity ethane feeds averaged 8¢/lb in third-quarter 2013. Production costs based on ethane in the quarter were 0.5¢/lb less than in second-quarter 2013 and 3¢/lb lower than in third-quarter 2012.
In third-quarter 2013, purity ethane provided ethylene producers with cost savings of 36¢/lb vs. natural gasoline. The cost advantage for ethane vs. natural gasoline in third-quarter 2013 was 7¢/lb more than in third-quarter 2012 and 16¢/lb more than in third-quarter 2011.
In fourth-quarter 2013, production costs based on purity ethane were almost unchanged from the previous quarter at 8¢/lb, which was 1¢/lb lower than in fourth-quarter 2012 and 24¢/lb lower than in fourth-quarter 2011. Purity ethane provided producers with a cost savings of 32¢/lb vs. natural gasoline in fourth-quarter 2013, which was 2¢/lb less than in fourth-quarter 2012 but 12¢/lb more than in fourth-quarter 2011. For second-half 2013, ethane cost advantage vs. natural gasoline averaged 34¢/lb.
For a plant with a capacity of 1 billion lb/year based on natural gasoline and similar light naphtha, the cost savings in second-half 2013 reached about $340 million. Ethane's cost advantage compared with natural gasoline and similar light naphtha continues to support retrofit projects of existing naphtha-based capacity and further expansion of US ethylene production capacity based on ethane as the primary feed.
Production costs for purity propane averaged 18¢/lb in third-quarter 2013, which was 6¢/lb more than in second-quarter 2013 and about 4¢/lb more than in third-quarter 2012. Production costs based on propane increased to 27¢/lb in fourth-quarter 2013, which was 9¢/lb more than in third-quarter 2013 and 15¢/lb more than in fourth-quarter 2012.
In third-quarter 2013, variable production costs for propane were 10¢/lb more than ethane, providing ethylene producers with cost savings of 25¢/lb vs. natural gasoline.
| Feedstock prices, coproduct values, and ethylene plant yields determine ethylene production costs. Petral Consulting maintains direct contact with the olefin industry and tracks historic trends in spot prices for ethylene and propylene. We use a variety of sources to track trends in feedstock prices. Some ethylene plants have the necessary process units to convert all coproducts to purity streams. Some ethylene plants, however, do not have the capability to upgrade mixed or crude streams of various coproducts and sell some or all their coproducts at discounted prices. We evaluate ethylene production costs in this article based on all coproducts valued at spot prices. |
In fourth-quarter 2013, variable production costs for propane rose to almost 19¢/lb more than ethane. But propane's cost advantage compared with natural gasoline in the fourth quarter fell to 13¢/lb.
In third-quarter 2013, variable production costs for natural gasoline averaged 43¢/lb, which was 6¢/lb more than in second-quarter 2013 and 3¢/lb more than in third-quarter 2012. Production costs for natural gasoline in fourth-quarter 2013 declined to 40¢/lb, which was 3¢/lb less than in fourth-quarter 2012.
Table 5 summarizes trends in ethylene production costs.
Ethylene pricing, profit margins
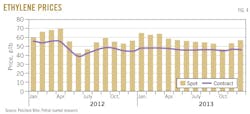
Spot prices for ethylene averaged 54¢/lb in third-quarter 2013 and 52¢/lb in fourth quarter, according to PetroChem Wire (www.petrochemwire.com). The contract benchmark, however, remained at 46¢/lb in both third and fourth quarters 2013.
The spot market's price premium compared with the contract benchmark was 8¢/lb in third-quarter 2013 but declined to 6¢/lb in the following quarter. Before 2011, spot prices were typically discounted compared with the contract benchmark.
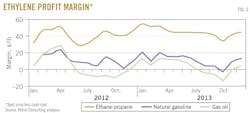
Margins based on contract benchmark prices and ethane production costs were steady and strong for ethane and propane in third and fourth quarters 2013, but margins for natural gasoline and naphtha were weak, remaining below breakeven for 4 out of 6 months during second-half 2013.
Production costs and margins based on purity ethane are more important to most ethylene producers than all other feeds since ethane accounted for 70-73% of US ethylene production in second-half 2013. Margins based for purity ethane were 33-34¢/lb in third and fourth quarters 2013.
Margins for propane weakened during second-half 2013, falling to 24¢/lb in third-quarter 2013 from 31¢/lb in second-quarter 2013. Margins for propane weakened further in fourth-quarter 2013, decreasing to 15¢/lb.
Margins based on natural gasoline feeds were 2.5¢/lb below breakeven in third-quarter 2013 and at parity to breakeven in the fourth quarter.
Fig. 4 shows trends in ethylene prices (spot prices and net transaction prices); Fig. 5 shows profit margins based on spot ethylene prices and variable production costs.
Propylene pricing
According to EIA statistics, inventory of refinery-grade propylene in US Gulf Coast storage averaged 583 million lb in third-quarter 2013 and remained about the same in fourth quarter. While inventory in third and fourth quarters 2013 was 64-66 million lb (12-13%) more than the 2009-11 average, it was 267 million lb (31.4%) less than in third-quarter 2012 and 137 million lb (19%) less than in fourth-quarter 2012. The decline in Gulf Coast inventory surplus supported stronger propylene spot prices in second-half 2013.
Spot prices for refinery-grade propylene increased to 58¢/lb in third and fourth quarters 2013 compared with 54¢/lb in second-quarter 2013.
Refinery-grade propylene spot prices in third-quarter 2013 increased by about 4¢/lb to average a 12.4¢/lb above unleaded regular gasoline. Although refinery-grade propylene prices remained nearly flat in fourth-quarter 2013, decreasing prices for unleaded regular gasoline increased refinery-grade propylene's price premium to 17.4¢/lb.
In third-quarter 2013, the contract benchmark for polymer-grade propylene varied within a range of 65-70¢/lb to average 68.5¢/lb, which was 5¢/lb more than in second-quarter 2013. In fourth-quarter 2013, contract benchmark pricing for polymer-grade propylene averaged 68.2¢/lb.
Premiums for polymer-grade propylene contract benchmark prices vs. spot refinery-grade propylene prices varied within a range of 8-13¢/lb in third and fourth quarters 2013. Premiums averaged 10.0¢/lb in third-quarter 2013 and 10.4¢/lb in the fourth quarter.
First-half 2014 outlook
Petral Consulting's forecasts for ethylene and propylene prices as well as for ethylene plant economics in first-half 2014 are based on international benchmark crude oil prices of $105-115/bbl, which was the range of pricing for dated Brent and the OPEC reference basket during second-half 2013.
Petral Consulting forecasts total ethylene production cash costs in first-quarter 2014 will average 44-48¢/lb for natural gasoline and 55-65¢/lb for gas oil. In second-quarter 2014, cash production costs for natural gasoline will decline and will average 33-36¢/lb. Similarly, as the impact of peak demand for home heating oil runs its course, spot prices for gas oil will decline and cash costs will fall to 43-45¢/lb.
Cash costs for high-cost feeds are generally the primary determinant for spot ethylene prices. In first-quarter 2014, Petral Consulting estimates ethylene inventory increased by 750-800 million lb in third and fourth quarters 2013. The increases pushed total ethylene inventory to its highest level since fourth-quarter 2011.
Finally, no turnarounds have been announced for January and February, and one small unit will go off line sometime in March. In second-quarter 2014, Williams Olefins LLC's Geismar plant is scheduled to return to service with an expanded capacity (OGJ Online, Dec. 12, 2013). By June 2014, US ethylene capacity will be 2.1 billion lb/year and the additional capacity will probably displace production from high cost feeds by about 500 million lb/quarter in second-half 2014.
Based on variable costs plus fixed-cash costs for gas oil and natural gasoline, Petral forecasts spot ethylene prices will average 50-55¢/lb in first-quarter 2014. Based on prices in this range, profit margins for natural gasoline will be 7-10¢/lb in first-quarter 2014, but profit margins for gas oil will be 4-10¢/lb below breakeven.
As production from the first two incremental expansions of 2014 increases to capacity rates, Petral Consulting forecasts spot ethylene prices will fall to 40¢/lb in May and June. Profit margins for production from natural gasoline will average 5-9¢/lb, but margins for production from gas oil will be no higher than breakeven in second-quarter 2014.
Premiums for spot ethylene prices compared with the benchmark net transaction price were 6-10¢/lb in second-half 2013 vs. 10-17¢/lb in first-half 2013. Premiums were weaker in second-half 2013 due to the sustained increase in industry operating rates and rising inventory. In first-half 2014, Petral forecasts premiums for spot prices compared with the benchmark net transaction price will average 8-10¢/lb. On this basis, net transaction prices will average 46-48¢/lb in first-quarter 2014 and 42-46¢/lb in second-quarter 2014.
The market sometimes anticipates seasonal swings in refinery-grade propylene supply. Spot prices for refinery-grade propylene were 15-16¢/lb more than spot prices for unleaded regular gasoline prices in October and November, but the premium was 20¢/lb in December. Petral Consulting forecasts premiums for refinery-grade propylene will average 18-22¢/lb in January and February but will weaken in March to average 15¢/lb.
Premiums compared with unleaded regular gasoline prices will average 14-16¢/lb in second-quarter 2014. Premiums were 19.3¢/lb in first-quarter 2013 but narrowed to 8.4¢/lb in second-quarter 2013. Based on these comparisons, price premiums in second-quarter 2014 will be almost double year-earlier levels.
Contract benchmark prices for polymer-grade propylene increased to 74.5¢/lb in January of this year. Spot prices for polymer-grade propylene jumped to a 2.5¢/lb premium in December compared with the contract benchmark. Spot prices rarely maintain premiums compared with contract benchmarks, and spot prices had already reverted to discounts of 2-3¢/lb in January. Petral Consulting forecasts contract benchmark prices will decline by 1-2¢/lb/month in February and March and will be 70-71¢/lb in first-quarter 2014 and 68-71¢/lb in second-quarter 2014.
PADD: US Petroleum Administration for Defense Districts* | |
PAD District 1 (East Coast) consists of three subdistricts:
PAD District 2 (Midwest): Illinois, Indiana, Iowa, Kansas, Kentucky, Michigan, Minnesota, Missouri, Nebraska, North Dakota, South Dakota, Ohio, Oklahoma, Tennessee, Wisconsin. PAD District 3 (Gulf Coast): Alabama, Arkansas, Louisiana, Mississippi, New Mexico, Texas. PAD District 4 (Rocky Mountain): Colorado, Idaho, Montana, Utah, Wyoming. PAD District 5 (West Coast): Alaska, Arizona, California, Hawaii, Nevada, Oregon, Washington. *PADDs were delineated during World War II to facilitate oil allocation. | |
The author
Daniel L. Lippe ([email protected]) is president of Petral Consulting Co., which he founded in 1988. He has expertise in economic analysis of a broad spectrum of petroleum products including crude oil and refined products, natural gas, natural gas liquids, other ethylene feedstocks, and primary petrochemicals.
Lippe began his professional career in 1974 with Diamond Shamrock Chemical Co., moved into professional consulting in 1979, and has served petroleum, midstream, and petrochemical industry clients since. He holds a BS (1974) in chemical engineering from Texas A&M University and an MBA (1981) from Houston Baptist University. He is an active member of the Gas Processors Suppliers Association and serves on GPA's NGL Market Information Committee.
