Maintenance slows first-half 2014 US ethylene production
Dan Lippe
Petral Consulting Co.
Houston
Following a nearly flawless production record in second-half 2013, US ethylene producers maintained exceptional performance through first-quarter 2014. A surge in downtime due to turnarounds and unplanned maintenance during second-quarter 2014, however, brought production to its lowest level since second-quarter 2012.
Petral Consulting Co., based on results of its monthly survey of ethylene plant operating rates and feedslates, determined that ethylene production in first-half 2014 was 2.0 billion lb less than in second-half 2013.
Production curtailments from all causes in second-quarter 2014 were almost 300% more than in first-quarter 2014.
While ethylene production during the first two quarters of 2014 averaged less than output in second-half 2013, US producers still managed to increase ethylene inventories by almost 200 million lb in first-quarter 2014, according to statistics from the industry association American Fuel and Petrochemical Manufacturers (AFPM).
Petral Consulting estimated in July that further reductions in ethylene production rates during second-quarter 2014 decreased ethylene inventories in US Gulf Coast storage by at least 0.3-0.5 billion lb and expects the resulting tight supply to persist into September or October. AFPM statistics confirmed the July estimate in its second-quarter 2014 statistical report, which showed ethylene inventories fell by 679 million lb.
By the end of second-quarter 2014, additional ethylene production capacity was preparing to come online. LyondellBasell plans to begin production from the expansion of its LaPorte, Tex., plant during third-quarter 2014 (OGJ, July 7, 2014, p. 90; OGJ Online, July 28, 2014), while Williams Olefins LLC's plant at Geismar, La., is scheduled to return to service in September (OGJ Online, Aug. 5, 2014).
Petral Consulting estimates the ethylene industry's operating capacity in third-quarter 2014 will increase by 2.8 billion lb/year (7.5 million lb/day), and higher production rates will enable the industry to rebuild inventory by yearend 2014.
Petral Consulting surveys ethylene producers monthly to determine industry operating rates and demand for fresh feed. All volumes presented in discussions of feedstock demand and ethylene production are based on results of this survey.
Feedslate trends
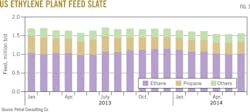
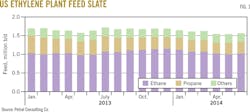
Ethylene industry demand for fresh feed reached 1.62 million b/d in first-quarter 2014 but declined to 1.54 million b/d in the second quarter alongside increased turnaround activity. Demand for fresh feed in first-quarter 2014 was 55,900 b/d (3.3%) less than in first-quarter 2013 and was 63,500 b/d (3.8%) less than demand in second-half 2013. Demand in secondquarter 2014 was 63,500 b/d (4.0%) less than in second-quarter 2013 and 141,400 b/d (8.4%) less than in second-half 2013.
Demand for LPG feeds (ethane, propane, and normal butane) averaged 1.46 million b/d in first-quarter 2014 but declined to 1.38 million b/d in the following quarter.
The decline in feedstock demand for ethane was consistent with the increase in plant downtime, but economic considerations as well as the increase in plant downtime contributed to the decline in feedstock demand for propane.
Demand for LPG feed in first-quarter 2014 was 24,000 b/d (1.6%) less than in first-quarter 2013 and 59,800 b/d (3.9%) less than in second-half 2013. Demand for LPG feed in second-quarter 2014 was 61,700 b/d (4.3%) less than in second- quarter 2013 and 138,900 b/d (9.1%) less than in second-half 2013. LPG feeds accounted for 91% of fresh feed in first quarter and 90% in second quarter.
Economics for ethane vs. heavy feeds remained consistently favorable throughout first-half 2014. The surge in propane prices in first-quarter 2014, however, increased production costs to 38-41¢/lb. As a result, propane's cost advantage vs. heavy feeds was 13.6¢/lb (52%) less than in third-quarter 2013.
Despite the decline in ethylene production in first-quarter 2014, demand for ethane remained strong. But downtime for scheduled turnarounds and unplanned outages weighed on ethane demand during second quarter.
Ethane demand was 1.09 million b/d in first-quarter 2014, up by 66,600 b/d (6.5%) from first-quarter 2013. During second-quarter 2014, ethane demand stood at 1.01 million b/d, only 16,300 b/d more than in the same quarter of the previous year.
The magnitude of the decline in ethane demand (76,500 b/d) from first-quarter 2014 to second quarter was more than three times the decline in demand (20,900 b/d) from first-quarter to second-quarter 2012.
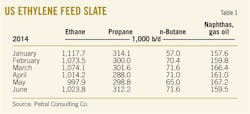
Ethane's share of total fresh feed was 67.1% in first-quarter 2014 and 65.5% in second-quarter 2014 vs. 67.2% in fourth-quarter 2013. Table 1 summarizes trends in olefin plant fresh feed.
US ethylene production
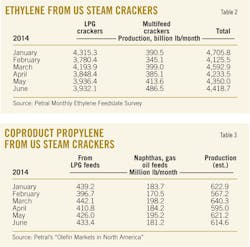
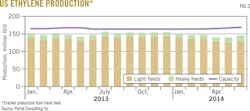
Ethylene production averaged 149.2 million lb/day in first-quarter 2014 and 142.9 million lb/day in the following quarter. Production in first quarter was 1.85 million lb/day (1.3%) more than the 3-year average. Production in second quarter, however, was 4.4 million lb/day (3.0%) less than the 3-year average.
Ethylene production in first-quarter 2014 was 236 million lb (1.7%) less than in first-quarter 2013; production in second-quarter 2014 was 293 million lb (2.2%) less than in second-quarter 2013. Production in first-quarter 2014 was also 807 million lb less than average production in second-half 2013.
While ethylene producers had a very light turnaround schedule in first-quarter 2014, production losses due to unplanned outages were five times more than in fourth-quarter 2013. In March 2014, Petral Consulting estimates scheduled turnarounds took 2.3 billion lb/year of nameplate capacity (1.3% of industry capacity) out of service, which resulted in production losses of 0.06 billion lb. In first-quarter 2014, Petral Consulting estimates production losses due to unplanned maintenance were 270 million lb vs. only 50 million lb in fourth-quarter 2013.
Ethylene producers had a much heavier turnaround schedule in second-quarter 2014. For those 3 months, capacity out of service for scheduled turnarounds averaged 5.8 billion lb (9.6% of nameplate capacity) and reached 8.1 billion lb/year in May. In second-quarter 2014, Petral Consulting estimates scheduled turnarounds resulted in 1.2 billion lb of lost production. Unplanned outages in those 3 months, however, resulted in 141 million lb of lost production, which was 127 million lb (47%) less than production losses from unplanned events during the previous quarter.
Ethylene producers were able to mitigate production losses during first-half 2014 by operating some plants at 95-100% (or more) of nameplate capacity. In first-quarter 2014, producers operated 52.8% of nameplate capacity at 95% or more. In the second quarter, producers operated 54.6% of nameplate capacity at 95% or more.
Light feeds now account for more than 90% of US ethylene production (OGJ, Sept. 2, 2013, p. 102). Ethylene production based on light feeds (ethane, propane, and normal butane) averaged 136.5 million lb/day for the first quarter this year. During second-quarter 2014, however, production from light feeds averaged 128.4 million lb/day, falling below 130 million lb/day for the first quarter since second-quarter 2012.
Production from light feeds in first-quarter 2014 was 37.9 million lb (0.3%) less than in first-quarter 2013. Production from light feeds in second-quarter 2014 was 410 million lb (3.4%) less than in the same period in 2013.
Until new grassroots ethylene plants come on stream in 2016-18, growth in ethylene production from light feeds will be slower compared with 2008-13.
Ethylene production from heavy feeds was 12.6 million lb/day in first-quarter 2014 and increased to 14.1 million lb/day the following quarter. Production from heavy feeds in first-quarter 2014 was 199 million lb (14.9%) less than in first-quarter 2013. Production in second-quarter 2014 was 116 million lb (10%) more than in second-quarter 2013.
Table 2 summarizes trends in ethylene production.
Production costs from light feeds (especially production costs for ethane and normal butane) during first-half 2014 were much less than production costs from heavy feeds during second-quarter 2013 through second-quarter 2014. Ethylene production from heavy feeds, however, varied within a narrow range of 12.5-14.5 million lb/day for 5 consecutive quarters.
Petral Consulting's monthly survey of ethylene producers shows five plants accounted for 75-80% of total heavy feeds consumption from 2013 through second-quarter 2014.
Three projects to expand the US Gulf Coast ethane pipeline grid are under way and will increase the ethylene industry's access to ethane supply in Mont Belvieu, Tex. (OGJ, June 2, 2014, p. 82) Until these projects come on stream, Petral Consulting expects ethylene production from heavy feeds will remain constant within the established range of first-half 2014.
Fig. 2 shows trends in ethylene production.
US propylene production
Coproduct propylene supply depends primarily on feedstocks with a large propylene yield (propane, normal butane, naphtha, and gas oil feedstocks).
Petral Consulting's monthly survey of ethylene producers showed demand first-quarter 2014 was 305,300 b/d for propane, 66,300 b/d for normal butane, and 161,300 b/d for naphtha and gas oil. In the following quarter, demand was 300,200 b/d for propane, 68,100 b/d for normal butane, and 163,200 b/d for heavy feeds.
Total demand for feeds with high propylene yield was 532,800 b/d in first-quarter 2014 and was 122,400 b/d (18.7%) less than in first-quarter 2013. Total demand for these feeds in second-quarter 2014 was 531,500 b/d and was 79,800 b/d (13.1%) less than in second-quarter 2013. As expected, coproduct supply in first-half 2014 was less than in the first 6 months of 2013.
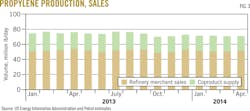
Petral Consulting estimates coproduct supply was 20.3 million lb/day in first- quarter 2014 and 20.1 million lb/day in second-quarter 2014. Coproduct supply for first-quarter 2014 was 313 million lb (14.6%) less than in first-quarter 2013, while second-quarter coproduct supply was 199 million lb (9.8%) less than in second-quarter 2013.
Propylene production from light feeds averaged 14.2 million lb/day in first-quarter 2014 and 14.0 million lb/day in the second quarter. Production from light feeds in first-quarter 2014 was 200 million lb (13.5%) less than in first-quarter 2013. Production from light feeds in second-quarter 2014 was 198 million lb (13.5%) less than in second-quarter 2013.
The year-to-year decline in propane demand was the key for year-to-year reductions in coproduct propylene supply from light feeds. Demand for propane in first-quarter 2014 was 120,000 b/d (28.2%) less than in first-quarter 2013. Demand for propane in second-quarter 2014 was 87,300 b/d (22.6%) less than in second-quarter 2013.
Propylene production from heavy feeds declined in first-quarter 2014 but was unchanged in second-quarter 2014 vs. year-earlier volumes. Coproduct propylene from heavy feeds was 6.1 million lb/day in first-quarter 2014 and 6.2 million lb/day in the second quarter.
Production from heavy feeds in first-quarter 2014 was 113 million lb (17.0%) less than in first-quarter 2013, but production from heavy feeds in the second quarter this year was only 1 million lb (0.2%) less than in second-quarter 2013.
Table 3 summarizes trends in coproduct propylene supply.
PDH plant, refineries
According to PetroChem Wire, PetroLogistics's propane dehydrogenation plant on the Houston Ship Channel operated with almost no downtime in first-quarter 2014. During the second quarter, however, maintenance problems and a turnaround reduced production.
Petral Consulting estimates the plant produced 3.80-3.90 million lb/day in first-quarter 2014 and 2.95-3.05 million lb/day in the second quarter. Production in first-half 2014 was about 0.87 million lb/day (34.0%) more than in first-half 2013.
Refinery propylene sales into the merchant market are primarily a function of feed rates in fluid catalytic cracking units (FCCU), operating severity in FCCUs, and economic incentives to sell propylene rather than use it as alkylate feed. Variations in FCCU feed rates are the most important parameter, while economic factors are generally of secondary importance.
Statistics from the US Energy Information Administration (EIA; www.eia.gov) show FCCU feed rates averaged 4.60 million b/d in first-quarter 2014. Based on EIA weekly statistics for refinery crude runs, Petral Consulting estimates FCCU feed rates increased to 4.92-4.94 million b/d in second-quarter 2014. FCCU feed rates in first-quarter 2014 were 66,000 b/d (1.5%) more than in first-quarter 2013; feed rates in second-quarter 2014 were about 60,000 b/d (1.2%) more than in second-quarter 2013.
FCCU feed rates in Petroleum Administration for Defense Districts (PADDs) 2 and 3 are more important than broader US trends because refineries in these two regions usually account for 90-95% of refinery-grade propylene. (See accompanying box for PADD regions.)
According to EIA statistics for January through April and Petral Consulting's estimates for May and June, FCCU feed rates in PADDs 2 and 3 accounted for 75% of total US feed rates during first-half 2014, but refinery-grade propylene from refineries in PADDs 2 and 3 accounted for 91.6% of US supply in first-quarter 2014 and 91.4% in the second quarter. FCCU feed rates in PADDs 2 and 3 in first-quarter 2014 were 47,000 b/d (1.4%) more than in first-quarter 2013. FCCU feed rates in second-quarter 2014 were 120,000-130,000 b/d (3.5%) more than in second-quarter 2013. FCCU feed rates in PADDs 2 and 3 were 30.6% of crude runs in first-quarter 2014 and about 31.0% of crude runs in the second quarter.
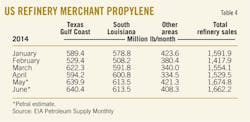
According to EIA statistics, refinery-grade propylene production was 50.1 million lb/day in first-quarter 2014. In the second quarter, Petral Consulting estimates refinery-grade propylene production was 53-54 million lb/day. Production in first-quarter 2014 was 26.3 million lb (4.3%) less than in first-quarter 2013. Production in second-quarter 2014 was 142.2 million lb (3.1%) more than in second-quarter 2013..
Based on EIA statistics for refinery-grade propylene (first-quarter 2014) and Petral Consulting estimates for coproduct supply and refinery-grade propylene supply in second-quarter 2014, total US propylene supply increased in first-quarter 2014, averaging 74.1 million lb/day (Table 4). Production was 240 million lb (3.4%) less than in first-quarter 2013, however.
Total US propylene supply increased in second-quarter 2014, averaging 76.7 million lb/day. This was unchanged from production during second-quarter 2013. Fig. 3 presents trends in coproduct and refinery-propylene sales, as reported by EIA and estimated by Petral Consulting.
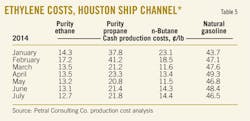
Production costs for ethylene on the Houston Ship Channel (assuming full spot prices for all coproducts) based on purity-ethane feeds were generally 12-14¢/lb in first-quarter 2014, but after spiking to 17¢/lb in February, averaged 15¢/lb for the quarter. Production costs in second-quarter 2014 were stable and averaged 13.2¢/lb.
Production costs based on purity ethane in first-quarter 2014 were 3.1¢/lb more than in fourth-quarter 2013 and 3.9¢/lb more than in first-quarter 2013.
Production costs for ethane are particularly important to petrochemical companies because production based on ethane now accounts for 70-74% of total production.
Purity ethane provided producers with continued cost savings vs. propane during first-half 2014. Ethane's cost advantage was 18-19¢/lb in first-quarter 2014 and 8-9¢/lb in the second quarter.
Ethane's cost advantage vs. propane was less in second-quarter 2014 primarily because propane prices in Mont Belvieu were 23¢/gal lower in second-quarter 2014 compared with the first quarter, while ethane prices declined by only 6¢/gal.
Purity ethane's cost advantage vs. natural gasoline was 31¢/lb in first-quarter 2014 and 35¢/lb in the second quarter. The cost advantage for ethane vs. natural gasoline in first-quarter 2014 was 5.4¢/lb less than in first-quarter 2013 and 2.4¢/lb less than in fourth-quarter 2013. Ethane's cost advantage declined in first-quarter 2014 because ethane spot prices increased more than spot prices for natural gasoline, while coproduct credits for natural gasoline increased due to a rise in propylene prices.
In second-quarter 2014, purity ethane's cost advantage vs. natural gasoline increased to 35¢/lb. Ethane's cost advantage increased during the second quarter because ethane prices and ethylene production costs declined beside steady natural gasoline prices, while coproduct credits declined due to a decrease in propylene prices amid rising production costs for ethylene based on natural gasoline.
For a plant with a capacity of 1 billion lb/year based on natural gasoline and similar light naphtha that has flexibility to operate with 100% purity ethane, the cumulative cost savings in first-half 2014 was about $165 million.
Ethane's cost advantage vs. natural gasoline (and other light naphtha of similar quality) continues to provide strong economic support for retrofit projects of existing naphtha-based capacity and further expansion of US ethylene production capacity based on ethane as the primary feed.
In first-quarter 2014, spot prices surged for both purity propane and polymer-grade propylene. Although the increase in propylene prices partially offset the increase in propane prices, ethylene production costs for purity propane increased to 41-42¢/lb in February 2014. As propane prices fell, ethylene production costs declined in March and were 33-34¢/lb for first-quarter 2014.
While production costs based on propane in January and February were 30-33¢/lb more than during the same months in 2013, production costs based on purity propane in March were only 9¢/lb more compared with costs in March 2013. Production costs in second-quarter 2014 were 22¢/lb, which was 4-9¢/lb more than in second-quarter 2013.
In January and February 2014, propane's production cost advantage vs. natural gasoline was only 5-6¢/lb. As propane prices declined, propane's cost advantage vs. natural gasoline widened to 26-27¢/lb in March and averaged about 13¢/lb in first-quarter 2014. Propane's cost advantage was 26-27¢/lb in the second quarter.
Production costs for natural gasoline in first-quarter 2014 were almost unchanged vs. fourth-quarter 2013, averaging 46-47¢/lb. Production costs for natural gasoline in first-quarter 2014 were 1.5-2.0¢/lb less than in first-quarter 2013. Production costs for natural gasoline in second-quarter 2014 increased to 48-49¢/lb and were 6¢/lb more than in second-quarter 2013. Table 5 summarizes trends in ethylene production costs.
Ethylene pricing, profit margins
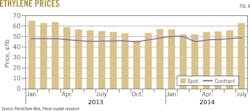
According to PetroChem Wire, spot prices for ethylene were about 57¢/lb in January 2014 but were 51-52¢/lb in February and March, averaging 53.5¢/lb for first-quarter 2014. Spot prices for first-quarter 2014 were 1-2¢/lb more than in fourth-quarter 2013.
A decline in ethylene production during second-quarter 2014 resulted in reduced US inventory levels. As supply tightened, spot prices for ethylene increased to 54-56¢/lb in second-quarter 2014, according to PetroChem Wire.
Net transaction pricing (NTP) for ethylene was 50.25¢/lb in January but settled lower in February (49.5¢/lb) and March (45.25¢/lb). NTP prices, however, reversed course in second-quarter 2014, increasing by 0.75-1.0¢/lb/month to average 47.2¢/lb for the second quarter.
Spot ethylene prices maintained premiums of 2-6¢/lb vs. NTP prices in first-quarter 2014 before premiums increased to 7-8¢/lb in second-quarter 2014. The increases in premiums for spot prices support Petral Consulting estimates that inventory declined by 0.3-0.5 billion lb in second-quarter 2014, but AFPM data showed inventory increased by 0.68 billion lb.
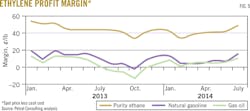
While margins based on contract benchmark prices for ethane and propane remained strong in first-quarter 2014, they remained slightly lower than in fourth-quarter 2013. Margins for ethane were 38-39¢/lb in first-quarter 2014, which was 1-2¢/lb less than in fourth-quarter 2013. Margins for propane dipped to a low of 10¢/lb in February 2014 before rebounding in March to 30-31¢/lb, which resulted in an average of 20¢/lb for the quarter. Margins for purity ethane improved in second-quarter 2014 and were steady within a range of 40-43¢/lb. Margins for propane also improved to 31-34¢/lb in second-quarter 2014.
Margins for natural gasoline were weak during first-half 2014. During first-quarter 2014, natural gasoline margins fell from 13¢/lb in January to 4-5¢/lb in February and March for a quarterly average of 7.4¢/lb. In second-quarter 2014, margins based on natural gasoline varied within a range of 4-8¢/lb and averaged 6.7¢/lb for the quarter.
Fig. 4 shows trends in ethylene prices (spot prices NTP prices); Fig. 5 shows profit margins based on spot ethylene prices and variable production costs.
Propylene pricing
According to EIA statistics, propylene inventory in Gulf Coast storage stood at 604 million lb on Apr. 1, 2014, which was 40 million lb (6.2%) less than in fourth-quarter 2013 and 27 million lb (4.3%) less than the 2011-13 average. EIA weekly statistics showed refinery-grade propylene inventory increased by 146 million lb during second-quarter 2014 to about 750 million lb as of July 1.
The reduction in refinery-grade propylene inventory during first-quarter 2014 supported spot prices for refinery-grade propylene at 62¢/lb-the highest quarterly average since first-quarter 2013.
Refinery-grade propylene inventory continued to decline in April, but additional tightening in availability provided no further support for spot prices in second-quarter 2014. Markets instead anticipated the seasonal increase in supply.
According to PetroChem Wire, spot prices for refinery-grade propylene fell to 57¢/lb in second-quarter 2014, averaging 4.4¢/lb less from the previous quarter. During second-quarter 2014, PetroChem Wire reports showed spot prices fell to 53-54¢/lb in June from 60¢/lb in April. As spot prices declined, refinery-grade propylene's premium to unleaded regular gasoline narrowed to 10¢/lb in second-quarter 2014 vs. 17-21¢/lb in the first quarter.
In first-quarter 2014, the contract benchmark for polymer-grade propylene increased to 74.5¢/lb in January but declined during February and March for a quarterly average of 73.3¢/lb. As spot prices for refinery-grade propylene fell during second-quarter 2014, the contract benchmark for polymer-grade propylene declined, averaging 69.7¢/lb for the quarter. The contract benchmark for June 2014 for polymer-grade propylene was 67¢/lb, which was 7¢/lb less than in January 2014.
Contract benchmark prices for polymer-grade propylene maintained strong premiums compared with spot refinery-grade propylene prices. Premiums were 11.7¢/lb in first-quarter 2014 and 12.4¢/lb in the second quarter vs. 10.4¢/lb in fourth-quarter 2013.
Second-half 2014 outlook
US ethylene production has not declined for 3 consecutive quarters since 2009. Ethylene production in first-quarter 2014 was less than in fourth-quarter 2013. Producers, however, began to curtail production in first-quarter 2014 due to mounting ethylene inventory.
According to AFPM quarterly statistics, ethylene inventory increased by 755 million lb in second-half 2013 and by 187 million lb in first-quarter 2014. Ethylene production fell again in second-quarter 2014, with producers experiencing more downtime for scheduled turnarounds than in any quarter since second-quarter 2012. Despite the decline in production in second-quarter 2014, Petral Consulting estimates that on July 1 ethylene inventory remained higher than its historic mid-range volume of 900 million lb.
Downtime for scheduled turnarounds during third and fourth quarters 2014 will be less than in second-quarter 2014, and in-service operating capacity will increase. Unless prices fall sharply in second-half 2014, higher ethylene production rates will boost ethylene inventory.
Based on these considerations, Petral Consulting expects ethylene production will increase to 148-152 million lb/day in second-half 2014, while cumulative production during the same period will climb 1.0-1.5 billion lb above output levels during the first 6 months of 2014.
Trends in supply-demand balances for ethane and propane are equally important for the US ethylene industry. Due to turnarounds and unplanned outages, ethane demand declined in second-quarter 2014 even as ethane production increased. Petral Consulting estimates ethane inventory in Gulf Coast storage increased by 5-7 million bbl during second-quarter 2014 and was 29-30 million bbl on July 1.
Although ethane prices were too weak to support full ethane recovery for many gas plants in the Rocky Mountains and Midcontinent during second-quarter 2014, ethane rejection in the Rocky Mountains and Midcontinent was less than in second and third quarters 2013. As a result of the inventory surge in second-quarter 2014, ethane prices will experience sustained bearish pressures during second-half 2014. Petral Consulting forecasts ethylene production costs based on purity ethane will average 12-14¢/lb and may fall as low as 10-12¢/lb.
Second, although propane inventory in Gulf Coast storage on May 1 was 7 million bbl lower than year-earlier volumes, inventory was also only 0.8 million bbl less than the average for 2009-11. EIA weekly statistics show propane inventory in Gulf Coast storage increased by 10-11 million bbl during May-June. On July 1, propane inventory in Gulf Coast storage was 2-3 million bbl more than the 2009-11 average. As inventory levels increased to surpluses vs. historic average levels during May and June, bearish pressures increased, prompting weaker spot prices in Mont Belvieu.
Petral Consulting expects propane inventory in Gulf Coast storage will continue to increase during third-quarter 2014, while ethylene production costs based on purity propane will average 21-23¢/lb. In third-quarter 2014, however, Targa Resources will complete Phase 2 of its LPG export terminal capacity expansion (OGJ, Sept. 2, 2013, p. 102). Petral Consulting expects international buyers will increase purchases of propane supply from Gulf Coast storage, and waterborne exports may increase to record-high volumes. Furthermore, propane prices in the international market almost always increase in the fourth quarter due to the seasonal increase in heating demand in the northern hemisphere.
These factors will contribute to rising propane prices in Mont Belvieu in fourth-quarter 2014. Petral Consulting forecasts ethylene production costs based on purity propane will increase to 35-37¢/lb in November and December.
Natural gasoline and gas oil will remain the high-cost feedstocks for ethylene production, and Petral Consulting forecasts heavy feeds will continue to account for about 10% of US ethylene production during second-half 2014. Petral Consulting forecasts production costs based on natural gasoline and gas oil will be 50-55¢/lb in third-quarter 2014 and 55-60¢/lb in the following quarter.
The increase in production costs for high-cost feedstocks will be one of the primary influences on spot ethylene prices in the third and fourth quarters of 2014. If production losses due to turnarounds and unplanned outages are less in third and fourth quarters 2014 than in second-quarter 2014, ethylene production will increase to historically high rates.
Petral Consulting forecasts the increase in production will be sufficient to increase ethylene inventory. The rebound in inventory will also increase bearish pressures on spot ethylene prices. Petral Consulting forecasts ethylene prices will decline to breakeven vs. production costs from the high-cost feedstocks.
PADD: US Petroleum Administration for Defense Districts*
PAD District 1 (East Coast) consists of three subdistricts:
• Subdistrict 1A (New England): Connecticut, Maine, Massachusetts, New Hampshire, Rhode Island, Vermont.
• Subdistrict 1B (central Atlantic): Delaware, District of Columbia, Maryland, New Jersey, New York, Pennsylvania.
• Subdistrict 1C (lower Atlantic): Florida, Georgia, North Carolina, South Carolina, Virginia, West Virginia.
PAD District 2 (Midwest): Illinois, Indiana, Iowa, Kansas, Kentucky, Michigan, Minnesota, Missouri, Nebraska, North Dakota, South Dakota, Ohio, Oklahoma, Tennessee, Wisconsin.
PAD District 3 (Gulf Coast): Alabama, Arkansas, Louisiana, Mississippi, New Mexico, Texas.
PAD District 4 (Rocky Mountain): Colorado, Idaho, Montana, Utah, Wyoming.
PAD District 5 (West Coast): Alaska, Arizona, California, Hawaii, Nevada, Oregon, Washington.
*PADDs were delineated during World War II to facilitate oil allocation.
Source: US Energy Information Administration, Washington
Feedstock prices, coproduct values, and ethylene plant yields determine ethylene production costs. Petral Consulting maintains direct contact with the olefin industry and tracks historic trends in spot prices for ethylene and propylene. We use a variety of sources to track trends in feedstock prices.
Some ethylene plants have the necessary process units to convert all coproducts to purity streams. Some ethylene plants, however, do not have the capability to upgrade mixed or crude streams of various coproducts and sell some or all their coproducts at discounted prices. We evaluate ethylene production costs in this article based on all coproducts valued at spot prices.
The author
Daniel L. Lippe ([email protected]) is president of Petral Consulting Co., which he founded in 1988. He has expertise in economic analysis of a broad spectrum of petroleum products including crude oil and refined products, natural gas, natural gas liquids, other ethylene feedstocks, and primary petrochemicals.
Lippe began his professional career in 1974 with Diamond Shamrock Chemical Co., moved into professional consulting in 1979, and has served petroleum, midstream, and petrochemical industry clients since. He holds a BS (1974) in chemical engineering from Texas A&M University and an MBA (1981) from Houston Baptist University. He is an active member of the Gas Processors Suppliers Association and serves on GPA's NGL Market Information Committee.
