Mapping subsurface fractures using their elastic nonlinear response
Natural open fractures and joints play an important role in production from carbonate and consolidated sandstone fractured reservoirs because the fluid flow is strongly influenced by the fracture orientation and the fracture density. The ability to delineate and accurately map the fractures represents critical information that is necessary for field development strategies.
Quite often horizontal wells are used to improve production efficiency from fractured reservoirs. However, due to the absence of the information that accurately maps the orientation and location of the conductive faults, joints, and fractures, there is a risk that water cut from a horizontal well may increase rather than decrease if the well is not correctly positioned.
Using current seismic imaging technology, it is difficult to reliably measure the location, orientation, spacing, and connectivity of the open fractures in the reservoir formations.
Geologic fractures are cracks in the rocks that are caused due to stress. The fractures by themselves do not cause any vertical displacement of the rock formations.
Since there is no displacement in the rock formations involved in the fracturing process, there are no detectable seismic discontinuities in the reflection data. For this reason, mapping subsurface fractures by using any current seismic methods has been difficult and challenging.
Shear wave birefringence and azimuthal dependence of the attenuation of the seismic signals are the two methods that are sometimes used to map the fracture swarms. In most cases they provide ambiguous results.
The seismic industry needs a new method to detect open natural fractures in the subsurface rocks, since fractures control the efficiency of producing hydrocarbons from more than half of the reservoirs in the world.
Natural open fractures are planar discontinuities in a reservoir formation, where the elastic properties of the rocks on either side of the fracture are very much different than the fracture itself. There is a high degree of elastic nonlinearity at the planar discontinuity.
A seismic wave that travels through the fracture experiences the effects of that localized elastic nonlinear anomaly. The elastic nonlinearity of the fracture changes according to the orientation of the fracture and the angle at which the seismic wave travels through it.
This is caused due to changes in the fracture stiffness. The stiffness of the fracture depends on the orientation of the fracture. The stiffness normal to the crack is considerably reduced compared to the stiffness along the fracture. This seismic attribute of the elastic nonlinearity of the fracture can be successfully used to map the location and the orientation of the open fractures in a reservoir.
Elastic nonlinearity
In geoscience, the elastic nonlinear response of the rocks has been largely ignored in the past.
Experiments conducted at Los Alamos National Laboratory and similar other laboratories have shown that the elastic nonlinear response in the earth material is pervasive and the reason for this elastic nonlinearity is that rock contains an enormous variety of microscopic heterogeneous structural features such as cracks, joints, different grain structure, and cementation.
Johnson et al. and Donskoy et al. further attribute the large response to physical properties such as fractures, porosity, permeability, and pore fluids in the reservoir rocks. This nonlinear wave behavior implies that when the seismic wave propagates through a fractured rock, there is a local increase in the density and modulus during compression and a local decrease in density and modulus during rarefaction.
The waveform begins to change shape and harmonics are generated. The effect through a swarm of fractures is cumulative.
In the linear theory of elasticity a monofrequency seismic signal propagating through an elastic medium retains its original shape and no harmonics are formed, while the same signal propagating through a nonlinear elastic medium exhibits distortion and the harmonics of the fundamental frequency are generated.
Also, in an elastically nonlinear medium, the two simultaneously propagating elastic waves interact with each other, and mixing of the two primary waves takes place.
Westervelt in 1963 was the first to show that two nearsource, collinear (parallel), high frequency primary waves could interact with each other to produce acoustic waves with frequencies equal to the sum and difference frequencies of the primaries. In the case of a seismic pulse propagating through a nonlinear formation, individual frequencies in the spectrum interact with each other and spectral broadening takes place.
The behavior of nonlinear acoustics in reservoir rocks is analogous with the nonlinear behavior of the electronic devices. In a nonlinear electronic circuit, if a monofrequency is transmitted, harmonics are generated, and if two frequencies are used, they interact and mixing of the two signals takes place.
This unique property of the elastically nonlinear behavior of the sedimentary reservoir rocks, where the new frequencies not present in the input are created, can be effectively used to map in situ reservoir characteristics.
Fracture detection using marine impulsive seismic source
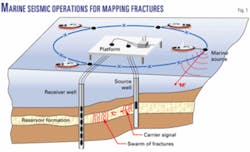
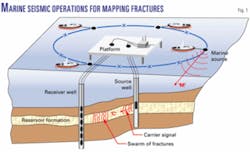
In the enclosed drawings, the basic concept of the field recording for fracture detection using marine seismic is shown with a simple schematic (Fig. 1).
A downhole seismic source is shown positioned at a selected depth in the source well, drilled through the reservoir formations. An array of seismic receivers is located in the receiver well to provide the coverage across the zone of interest in the reservoir. The wellheads are located on a marine platform, and both wells can be accessed from that platform.
The swarm of fractures in the reservoir formation is shown as S; however, this could be a joint or a conductive fault.
For this example a discrete preselected frequency of 1 khz for the downhole source is used. A marine seismic vessel is deployed on the surface that is free to be positioned to any desired surface location and to transmit a seismic acoustic impulse. The frequency bandwidth of the seismic impulse is in the range of 5-100 hz.
The marine source and the downhole source can be synchronized to transmit their signals simultaneously. The downhole source is deployed at regular depth intervals in the order of 5-10 ft to cover vertically the reservoir formations.
In the receiver well, a downhole receiver array that may have up to 100 receivers is positioned to vertically sample the reservoir formations of interest at 5-10 ft spacing. The selection of the vertical sampling is based on the required vertical resolution needed to map the fractured reservoir formation.
The downhole source, which is a vibratory source, transmits a seismic signal that is a discrete frequency of 1,000 hz and has a time duration of 5-6 sec.
Two sets of recordings are made. The first set is made without the marine source being activated. This set of crosswell seismic data is only recorded once. This data set is used as a reference during data processing and analysis.
For the second set of recordings, the downhole source is activated with an identical transmission signal as for the first set of recordings, but this time the marine source is also activated at a specific surface location. At every surface location, the downhole source is moved vertically to provide the necessary crosswell seismic coverage over the reservoir zone of interest.
Once this sequence of recording is completed, the surface source is moved to the next location. The pattern of the marine source is not limited in any way and may have any number of surface source locations in any geometric pattern considered necessary to map the fracture location and their orientation.
At each location of the marine source, crosswell seismic data are recorded. The crosswell recordings are made with 5 to 10 ft vertical spacing to get the complete seismic coverage over the reservoir formation. For each of these recordings, the marine source and downhole source are activated simultaneously.
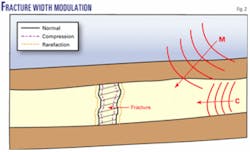
Fig. 2 illustrates the changes in the width of an open fracture, a joint, or a conductive fault, when the surface generated acoustic pulse that is acting as a 'modulation' wave M, arrives at a wide angle. The angle could be in the order of 45° to 60°.
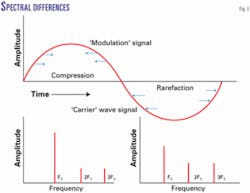
Open fracture is compressed during the compression cycle of the 'modulation' wave and opens during rarefaction cycle of the 'modulation' wave. The amplitude and the spectra of the 'carrier' wave 'C' as it travels through the fractures, change during the compression and the rarefactions cycles of the 'modulation' wave 'M.'
Indication of any amplitude modulation of the 'carrier' wave due to marine impulse wave confirms the existence of a fractured discontinuity between the source and receiver wells. For one source well, any number of receiver wells can be used simultaneously to locate the joints and fractures in a reservoir.
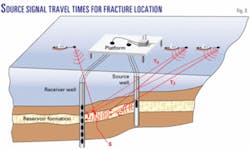
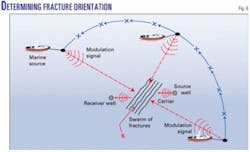
Fig. 3 illustrates that the subsurface fractures are at a fixed location in relationship to the well locations. The variable is the location of the marine source, which moves from one surface location to the next; the movement of the source from one location to the next changes the distance between the marine source and the subsurface fractures.
The distance between the marine source location and the receivers in the receiver well also changes. The distance of the fracture from the marine source is not known, but the distance between the source and the receivers is known.
If the distance between the source and the fractures can be determined using multiple and varying source locations, then the location of the fractures can also be established. The distances from the moving marine source to the fractures can be calculated if the arrival times from the source to the fractures can be determined.
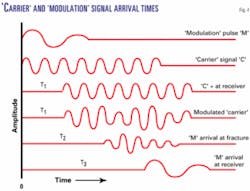
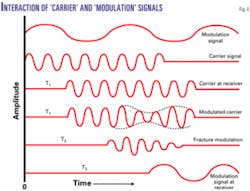
Fig. 4 illustrates how the arrival times at the fractures can be measured using the crossmodulation of the two signals. One signal is generated by the downhole source and the other is generated by the impulsive marine source. The crossmodulation between the two signals takes place as both signals propagate through the fractures simultaneously. Subtracting the 'carrier' from the modulated 'carrier' gives us the arrival time of the marine impulse at the fractures.
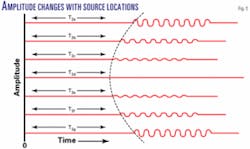
Fig. 5 displays the arrival times of the marine generated pulse at the fractures as the marine source is deployed in a circular arc. The amplitude of the crossmodulated arrival changes according to the relative orientation of the marine source and the fractures.
Fig. 6 is a diagrammatic display that shows the position of the marine source in relation to the orientation of the fractures. Fractures are not modulated when the marine source signal arrives at the fractures in the same plane as the fractures. Zero amplitude of the crossmodulated signal identifies the orientation of the fractures.
Fracture detection using vibratory seismic source
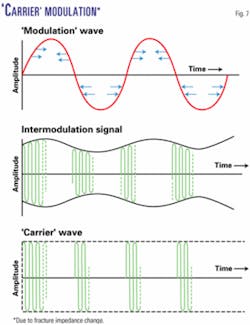
When a vibratory land or marine seismic source is used, a large amplitude, low-frequency 'modulation' signal is generated that squeezes the open fractures during the compression cycle and opens them during the rarefaction cycle.
The transmission of the 'carrier' wave through the swarm of fractures is affected by the compression and rarefaction cycles of the 'modulation' wave. The elastic properties of the fractures change during the compression and rarefaction cycle of the low frequency higher amplitude, 'modulation' wave. Fig. 7 shows the intermodulated 'carrier' signal.
Fig. 8 shows that the first arrival times of the 'modulation ' signal generated at the surface to the fractures can be derived similar to what is shown in Fig. 4. However, there is an important difference since the modulation signal generated by a vibratory source is a controlled discrete frequency; an analysis of the spectral differences of the 'carrier' wave during compression and rarefaction cycles of the lower frequency signal can be made.
The spectral changes of the 'carrier' signal during normal transmission and during compression and rarefaction of the 'modulation' wave are measured and analyzed.
Fig. 9 shows the changes in the amplitudes of the fundamental 'carrier' frequency and its harmonics. These changes are caused due to changes in the elastic properties of the fractures during normal transmission and during compression and rarefaction cycles of the 'modulation' wave.
The elastic properties of the fractures are related to the physical dimensions of the fractures and the fluids that are present. Viscosity of the fracture fluids plays an important part in controlling the transmission characteristics of the seismic signal that propagates through the fractures.
The harmonics that are generated directly relate to the elastic nonlinearity of the fluid-filled fracture. Higher viscosity fluid causes more hysteresis, which in turn generates higher contribution of the second harmonic. The relative measurements of the second and third harmonic amplitudes of the 'carrier' and the 'modulated carrier' provide useful information for determining the type of fracture fluids present in a reservoir.
The above-described method is superior to the current techniques since this method makes direct measurements of the transmission characteristics of the fractures rather than the indirect measurements of velocity and amplitude that provide ambiguous results.
Fracture detection is also important in construction and in determining the safety of the larger structures like dams. The method described in the article can also be applied for similar applications.
Mapping sweet spots in fractured reservoirs
Since fractured rocks exhibit strong elastic nonlinearity at right angles to the fractures and little or no nonlinearity along the fractures, this behavior can be utilized for mapping fractured reservoirs using three dimensional (3D) seismic, which offers 360° azimuthal angle distribution.
Two compressional vibratory seismic sources transmitting two collimated seismic waves are used for recording a normal 3D data set. This data set is recorded with field parameters so that it will provide a means of measuring nonlinear effects related to different azimuth angles. Thus mapping the location and the orientation of the fractures.
The nonlinear elastic interaction between the two transmitted signals, which results in the sum and difference of the two transmitted signals is processed to display different source-receiver azimuthal angles to map the location and orientation of the fractures.
The seismic image created using sum and difference of the transmitted swept frequencies of the two compressional waves, mentioned above, will be zero when the modulation source and the carrier source are located parallel to the fractures or directly above them. The interaction will also be zero when the sources and the receivers are located on the surface in such a manner that the recorded reflected signal does not intersect any subsurface open fractures.
The image representing the fractures will only be present when the source receiver azimuthal angle is at or near right angles to the fractures. Recording 3D seismic data using a normal swept frequency signal and a monofrequency signal creates three seismic images.
One seismic image is the standard image, which is conventionally used today. The other two images are created by crosscorrelation with the sum and difference frequencies of the swept frequency and the monofrequency.
The two sum and difference frequency images will map the fractures at higher amplitudes compared to nonfractured formations. The seismic image representing the azimuthal distribution of the seismic signal wave path at right angles to the fractures will have the highest amplitude.
The seismic signal arriving parallel to the fractures or directly above them will give no distinct image. In this manner the results of the nonlinear interaction between the two transmitted waves is used to determine the location and orientation of the fractures.
In marine seismic, where an impulse energy source is used, the nonlinearity of the fractures will broaden the transmitted spectrum. Additional lower and higher frequencies that are not present in the transmitted signal will be created.
Due to earth filtering, higher frequencies may get attenuated, but the lower frequencies generated due to fracture nonlinearity will be prominent in the seismic data, which are recorded at or near right angles to the fracture orientation. The lower frequency seismic image, displayed using different source-receiver azimuthal angles, will map the fracture location and orientation.
The future
The measurements of the elastic nonlinear response of the seismic waves as they propagate through porous, permeable, and fractured rocks, show a lot of promise as a sensitive measure of different reservoir characteristics.
The sensitivity of the nonlinear parameters (harmonics and interaction of two waves) to the changes in reservoir rock properties is larger than that of standard linear measurements of seismic velocity and attenuation. The measurements of the elastic nonlinearity parameters of the reservoir rocks can be used in unique and different ways to measure fractures, porosity, permeability, and pore fluids. The future applications of this new technology promises to be extensive.
Bibliography
Johnson, P.A., and Rasolofosaon, P.N.J., "Manifestation of Nonlinear Elasticity in Rock: Convincing Evidence Over Large Frequency and Strain Intervals from Laboratory Studies," Nonlinear Processes in Geophysics.
Johnson, P.A., and Shankland, T.J., "Nonlinear Generation of Elastic Waves in Crystalline Rock," Journal of Geophysical Research.
Meegan, G.D., and Johnson, P.A., "Observation of Nonlinear Elastic Wave Behaviour in Sandstone," Journal Acoustic Society of America.
Johnson, P.A., and McCall, K.R., "Observations and Implications of Nonlinear Elastic Wave Response in Rock," Geophysical Research letters.
Westervelt, P.J., "Parametric Acoustic Array," J. Acoust. Soc. Am., Vol. 26, 1963.
U.S. Patent Documents 6,175,536, January 2001, Khan, 367/32.
The authors
Tawassul Khan ([email protected]) is president and CEO of Nonlinear Seismic Imaging Inc. with over 40 years of experience in the seismic industry worldwide. His work history includes positions with Halliburton Geophysical Services, Reservoir Imaging Inc., Western Atlas International, and Baker Hughes Inc. He has held management positions in operations, research, business development, marketing, and engineering. He has a BA in physics and mathematics from Punjab University and a BS degree in engineering from London University.
Sofia McGuire ([email protected]) is vice-president of Nonlinear Seismic Imaging and is involved with managing the company's business activities. She has been involved independently in financial services since 1986. She holds a BA degree in managerial studies from Rice University and an executive MBA degree from the University of Houston.
