Digital transformation improves gas field operations
Steve Hendon
eSimulation Inc.
Houston
The midstream natural gas-gathering business is the ideal candidate for digital transformation, as it includes assets spread out remotely that can benefit from Industrial Internet of Things (IIoT) technologies to inexpensively gather previously wieldy information. Big-data analytics—integrating unstructured data (manually entered asset data) with structured or continuous data (usually from supervisory control and data acquisition, SCADA) into a cloud-based platform— allows analytic solutions to drive strategic improvements.
A digital twin process continually collects sensor data and applies advanced analytics and artificial intelligence to gain insight into how the systems function. From this approach’s perspective, applying business-modeling technology to optimize the entire business, forecast sales volumes, and perform what-if case studies provides the ultimate platform to drive profit improvements. Many oil and gas companies are taking steps to improve efficiency and profitability by digitizing key business processes. While this transformation has been ongoing for many years, new technologies are making the process easier and more profitable.
Digital transformation is the implementation of digitization (the process of converting analog information in any form—including paper documents, photographs, voice—into a digital, or computer-readable format) and digitalization (the automation of existing manual and paper-based processes, enabled by the digitization of information from an analog to digital format) throughout an organization by focusing on both people and business processes. Transformation is accomplished by engaging the entire company and people that make up the company rather than just the processes and data that are part of the company.
This article examines a project eSimulation Inc., Houston, undertook in late 2013 to help improve the efficiency of a US midstream operator’s condensate business by helping the operator transform its management from paper and spreadsheets to specialized digital applications. It reviews the digital transformation of gathering-field operations and discusses how the various support groups—including environmental, health, and safety (EHS), plant operations, measurement, accounting, engineering, and marketing—have benefitted from having a common-decision platform with which to manage the midstream gathering business.
Background
Natural gas-gathering field operations encompass a wide range of processes, including:
• Pipeline operations and maintenance.
• Dehydration and treating installations.
• Gas processing installations.
• Compression.
• Condensate storage and sales.
• Water storage and disposal.
• Greenhouse gas (GHG)-vent emissions measurement.
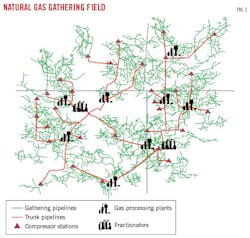
Fig. 1 shows a general map of a typical US gathering system.
Condensate inventory management
For most midstream companies, the condensate produced in the gathering system has historically been regarded as a nuisance liquid with little effect on profitability. With the high liquid content of the natural gas produced from shale formations, the condensate recovered has changed from a nuisance liquid to a profit center, but most midstream companies continue to manage the condensate business on paper and spreadsheets.
A variety of factors make the condensate business, by its very nature, a complicated one:
• Accurate measurement of condensate and water in gas pipelines is difficult to obtain.
• Actual flow measurements (i.e., turbine, Coriolis, etc.) are expensive to install and maintain.
• Evaporation, flashing, weathering, and other factors make accurate volume measurement challenging.
• Due to the high value of the condensate and extensive use of unmanned facilities, the risk of loss through theft is high.
• State and US Environmental Protection Agency regulations require detailed record keeping for gas vents, condensate, and water production from the gathering system, which can be complicated to track.
Beginning in late 2013, eSimulation worked with a midstream company whose condensate business involved multiple condensate stabilizers and numerous tank batteries to collect condensate from field compressors across multiple gathering systems. In some cases, condensate was hauled to the stabilizers, while in other cases, unstabilized condensate was sold directly to buyers. These condensate movements created hundreds of truck tickets each month for hauling and selling condensate, which were reconciled manually. Manual processes also were used for regulatory and reporting requirements.
Condensate business workflow
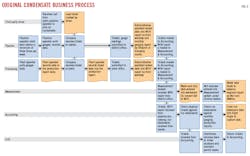
eSimulation first analyzed the client’s condensate workflow. The analysis revealed that different groups within the company created and maintained multiple spreadsheets on a monthly basis with much of the information copied from one to another. The translation of data from one group to another and from one spreadsheet to another was inefficient and created opportunities for transcription errors. Fig. 2 shows the inefficiency of the manual workflow management of the condensate business.
The operator’s condensate business workflow was managed by four different business groups, each needing the same data reported in a different way in a highly disjointed, labor-intensive process requiring multiple spreadsheets, as well as extensive paper processing and data translation between groups:
• At the first of each month, the field operations group found itself inundated with requests for volume and composition data for individual sites. Further, various groups would call individual field operators and ask for information because the information required wasn’t standardized. The field operator was fielding multiple calls daily and, at times, spending more time filling out forms and answering questions than overseeing operations.
• The measurement group converted the condensate and water volumes generated by the pipeline and processing groups spreadsheets from liquid barrels to equivalent gas volumes and then entered the data manually into the measurement system.
• The accounting group manually crosschecked truck tickets with buyer statements for the correct volume and purchase price. Missing tickets, incorrect volumes, and wrong-ticket locations had to be researched.
• For the EHS group, the long-lag times between when condensate was produced and when volumes were reported resulted in difficulties meeting reporting requirements.
For all the groups, manual entry of the same data in multiple spreadsheets was inefficient and tedious.
Project specification
To address the operator’s workflow problems, eSimulation designed the software required to improve the condensate workflow and helped identify and quantify operational benefits by developing Oil and Gas Volume Tracker—a cloud-based, rigorous material-balance application that allows producers to track production and analyze balances across assets—to form the basis for the condensate inventory management system (CIMS). Together, these two applications formed the kernel for the eSimGathering application suite.
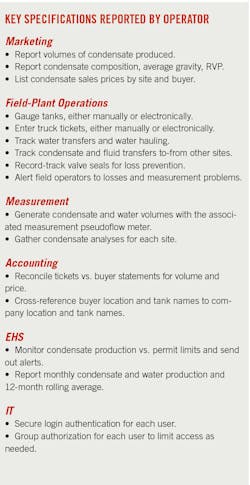
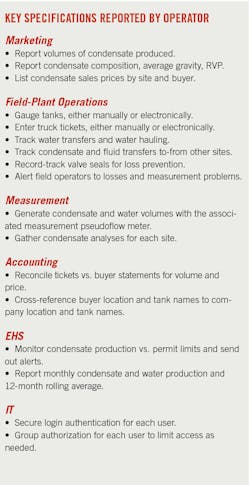
Following eSimulation’s development of a preliminary software design to optimize workflow, the next step engaged the individual business groups that managed the condensate business process to identify the data they needed to support the business process and the reporting deliverables for which they were responsible (see accompanying box).
Once the deliverables were specified, eSimulation asked each group to estimate the reduction in time to support the condensate business process if the workflow could be optimized. The primary benefits identified by each group included more accurate and timely data, higher efficiency, and reduced costs for business support.
Given their view of the existing process as cumbersome and difficult, the individual groups willingly provided detailed estimates and specifications by which to reduce efforts. From these specifications and the general business workflow, eSimulation developed a tailored CIMS solution for the operator.
To ensure fast development and deployment of the CIMS, eSimulation had endusers test and provide feedback throughout the development cycle. Each of the operator’s business groups were provided resources to test the different software components as they were developed to identify software-design and business-process issues. This process enabled an expedited, relatively trouble-free rollout of the final product with built-in increased functionality for the enduser groups. Requisite training was accomplished using a train-the-trainer methodology.
Optimized condensate workflow
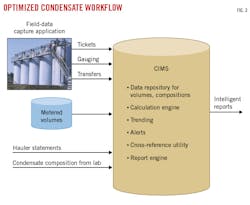
Work with the operator produced a simpler workflow using the cloud-based web interface and SQL database in eSimGathering (Fig. 3). Specifically, the eSimGathering solution was designed to:
• Store individual tank gauging.
• Store truck ticket data.
• Provide alerts for missing or inaccurate data.
• Provide intelligent reports to the measurement, accounting, marketing, and EHS groups.
• Reconcile truck ticket data with buyer statements automatically at the end of the month to greatly simplify accounting efforts.
• Streamline the condensate business workflow by providing a single source for condensate and water data.
In the optimized workflow, each business group is responsible for maintaining the specific business data it needs for each asset. The field operations group creates the specific facilities and configures the condensate and water tanks, while the measurement group updates the condensate analysis and specific pseudometers for balance segments in the measurement system. The marketing group updates the condensate buyers and water haulers for each facility as well as condensate contract details used to calculate the monthly condensate purchase price for the accounting reconciliation. The accounting group updates the condensate buyer data for each facility, while the EHS group updates the permit limits used for the permit-limit violation alerts.
CIMS also allows the accounting group to import daily electronic truck tickets from buyers (when possible) and to provide end-of-month condensate statements in an electronic format, such as a CSV or Excel. Buyer statements are imported into CIMS to reconcile the statements to truck tickets.
There are some limitations to the ability to utilize digitalization, however. Not all condensate buyers are equipped to provide the run tickets in an electronic format, so some field operators may have to enter those tickets manually. Also, while electronic tank gauging can be used where it is available (e.g., at processing plants), manual tank gauging must remain in use where electronic gauging is unavailable (e.g., at most compressor stations). Strapping tables can be used for any tank but are required for any tank that cannot be gauged manually (e.g., bullet tanks).
For the operator, developing and deploying the software solution allowed it to make business process modifications to support the initiative. For example, car seals used on the condensate tank valves for loss prevention were modified. Originally, the car seals were attached to the condensate tank valves, resulting in two car seals for every tank. Programmatically, this wasn’t a problem. In practice, however, this was difficult to track because of the large number of car seals involved and tracking car seals for intrafacility transfers as well as condensate loadouts. For this reason, the operator modified the business to only require car seals on the loadout valves where actual losses from theft could occur. This also simplified operations and was well received by the field operators.
The CIMS rollout took about 4 months after development, including time to train everyone to use CIMS and to switch everyone over from spreadsheets. During this time, both the spreadsheets and CIMS were maintained. When the use of the spreadsheets was discontinued and the transition to CIMS was completed, eSimulation obtained sign off on the functionality from all groups, and both eSimulation and the operator were pleased when all groups were very supportive.
Entrusting the operator’s specific business groups with responsibility for their own data resulted in a huge increase in workflow efficiency, as the data were entered directly instead of being passed from one group to another, eliminating duplicate efforts and the chance for errors.
GHG-emissions reporting
Initiated in 2016, EPA’s GHG Reporting Program–Subpart W requires the reporting of gathering-and-transmission pipeline and compressor vents associated with maintenance and pigging operations. Following the successful rollout of CIMS, the same US midstream operator decided to use eSimGathering as the common platform for a GHG-emissions reporting application because of the program’s ability to digitalize the emissions data in a single database for later aggregation and reporting. EPA’s rules require that pipeline and compressor gas emissions be reported by geographic operating area and by asset type, but these areas are different for transmission assets vs. gathering assets. With an extensive gathering and transmission pipeline system spanning multiple states, this requirement posed a major challenge for both implementation and rollout.
Calculating compressor GHG gas vents from startups, purges, and blowdowns is complicated by the compressor-specific calculations required. These calculations must account for not only the compressor details but the piping layout as well. Development and maintenance of these calculations takes a large amount of time and effort when hundreds of compressors are in service. Since the operator already had spreadsheets with detailed compressor start, purge, and blowdown calculations, eSimulation was tasked with using these within the eSimGathering platform to allow compressor engineers to build and maintain the existing spreadsheet calculations for each compressor’s vent calculations.
eSimulation developed the GHG solution to allow compressor engineers to upload their calculation spreadsheet into the GHG gathering solution and use those calculations for all vent reporting. Each spreadsheet is attached to the compressor configuration in eSimGathering and can be downloaded and updated as necessary while keeping the previous versions available. The eSimGathering configuration also allows for compressors to be moved from one site to another while keeping the same calculations, both simplifying the compressor calculation maintenance and tracking and minimizing errors. Reports for the compressor vent volumes at each site are quickly created and easily aggregated for each gathering system by operating area, or for each transmission system by operator and state.
eSimGathering’s cloud-based platform provides a common solution for both the gathering and transmission groups. Different GHG-emissions pipeline segments are created based on the balance segments used in the measurement system, or where the pipelines cross geographic boundaries (e.g. county and state lines). The pipeline operator selects the pipeline segment being vented (or identifies the location so the segment can be entered later) and enters the required data to calculate the vent volume. The measurement group provides the meter number for the pipeline segment so that the vent volume is included in the monthly LAUF balance calculations.
Using eSimGathering for the GHG-vent reporting improved quality and accuracy of GHG-vent data, decreased effort to record data throughout the year, and greatly reduced time and effort required to compile the annual GHG-emission volumes for the gathering and transmission systems. Based on 2017 results, the operator reduced the time required to compile the annual report to days from weeks, with a corresponding improvement in its confidence in initial quality and accuracy of data.
Pig tracking
The pig-tracking application captures details about each pig launch or return and calculates GHG-emissions volumes automatically, recording all relevant data regarding launching or receiving pigs (including GHG venting) reported in the GHG-emissions application. The application automatically generates alerts when a pig is launched or a pig receiver is full. A monthly pig report details the number and type of pigs run for each pipeline segment along with information about chemicals added, liquid volumes received, samples taken, and the presence of solids. Analysis of this pig-tracking data looks for overpigging or underpigging of pipeline segments and monitors corrosion control.
Going mobile
The field operations group is the largest single user group for eSimGathering and provides most of the input data for CIMS, GHG-emissions reporting, and pig tracking. In 2017, eSimulation developed a mobile application for field operators to enter data using notebook computers, iOS, or Android mobile devices.
The application allows the operator to enter gauging, truck-ticket, or gas-vent data while in the field even when an internet connection is unavailable, with the data stored locally. When connected to the cloud, the application synchronizes with the eSimGathering database and uploads any new data. This data synchronization provides a big efficiency improvement by reducing the time and effort required to input the data and load it into eSimGathering.
Another application feature is its ability to maintain a reduced historical data set of the infrastructure for which the operator is responsible, replacing the manual log sheet (paper or spreadsheet) the field operator maintains with a digital version. This historical data is readily available, making it easier to spot issues requiring attention and resulting in management and engineering groups having easily searchable or trending data available quickly.
Digital transformation benefits
Implementation of CIMS and the GHG-vent reporting applications:
• Minimizes and standardizes data collected for all support groups. Each group gets what it needs in custom-designed reports. CIMS drastically reduces the load on field operations to gather data and to answer questions from the various support groups.
• Provides an accurate inventory of all liquids assets for full review.
• Creates mathematical integrity across assets and with all groups supporting the business.
• Is easily auditable.
• Allows operators to explain discrepancies outside tolerances. Losses become documented, visible, and transparent, protecting the operator.
• Allows EHS to see where it stands relative to permit limits for each site. The CIMS permit alerts allow EHS to proactively address potential permit-limit violations much earlier.
• Makes it much easier to run accruals, keeping estimates to actuals tighter.
• Improves reconciliation of statements and tickets.
• Simplifies Sarbanes-Oxley controls management by monitoring run tickets to statements. Deviations are easily identified for further action. Because tickets are easy to verify, every ticket is easily accounted for.
Most compellingly, the operator estimates the CIMS package has resulted in a 20-30% reduction in field-operations manpower required to support the condensate business process, allowing these employees to be reassigned to more productive work in broader business operations.
The author
Steve Hendon ([email protected]) is a cofounder of eSimulation Inc., Houston, where he designed, developed, and now implements the eSimulation Optimizer and Evaluator optimization software for natural gas processing plants and associated gathering systems. With 34 years’ experience in development and implementation of real-time optimization and multivariable control projects in refining, petrochemicals, gas processing, and NGLs, he worked for ExxonMobil Corp., Aspen Technology Inc., and Dynamic Matrix Control Corp. before starting eSimulation in 2000. Hendon earned a BS (1984) in chemical engineering from the University of Oklahoma.
