Here are velocity aspects of wavelet energy absorption
WAVELET ENERGY ABSORPTION—2
This is the second of three parts on the use of wavelet energy absorption in direct hydrocarbon detection.
Energy attenuation in gas-filled pores
In most cases, the velocity of sound in partially saturated rock is significantly greater than in pure gas under the same pressure and temperature. What this means is that the wave-propagation process in rock is actually supersonic in relation to gas within pore space.
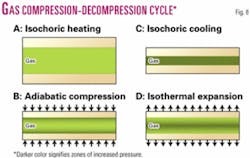
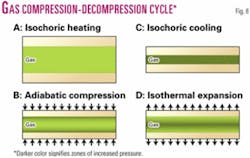
Hence (see for example Kondic´, et al.9), the instantaneous velocity of the wall of the pore can exceed the speed of sound in the gas within the pore. To illustrate this, let us analyze in detail the gas compression-decompression cycle (Fig. 8).
In the state A of maximum decompression, the pore wall moves very slowly and pressure in the surrounding rock is increasing. In this state the gas inside the pore space is heated without significant change in volume (isochoric heating). Since the volume does not change, no energy is lost during the state A.
Due to continuing increase of pressure in the surrounding rock, the pore wall is accelerating until its speed exceeds the velocity of sound in the gas inside the pore (state B). The gas is forming the zone of drastically increased pressure (shown in the dark color) in close proximity to the wall. In this state the process is going too fast for any significant heat exchange to take place (adiabatic process) between the gas inside the pore space and the surrounding rock.
When the pore is fully compressed (state C), the gas pressure inside the pore space is at its maximum and the velocity of the pore wall is very low. Then, the gas is cooled down without much change in the pore volume (isochoric cooling). No energy is lost in state C. The reason for this is the same as in state A, the volume of gas is not changed significantly.
In state D, the pressure in the rock is dropping and the wall is accelerating in the opposite direction. Again, its speed is greater than the velocity of sound in gas. Hence, the gas cannot follow the wall and expands into near vacuum (shown in light color) formed behind the wall. During this state the temperature of gas does not change (isothermal process).
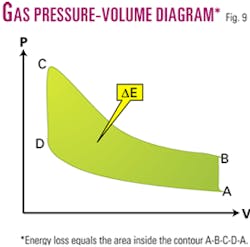
The transition of gas between states is shown on the pressure-volume (PV) diagram (Fig. 9). From the state of minimum pressure, maximum volume (state A) the isochoric (V = const) heating takes place converting gas into state B. The adiabatic (no heat exchange) compression is the dominant process between states B and C. At state C (maximum pressure, minimum volume) the isochoric cooling process takes over, converting gas into state D. The rapid expansion of the pore volume results in the isothermal (T = const) transition back to state A.
The loss of energy during this compression-decompression cycle is equal to the area inside the A-B-C-D-A contour line.
So, the gas-filled pore behaves in a fashion similar to a steam engine. The mechanical energy of the moving wall of the pore is transferred to heat by compressing and decompressing the gas inside the pore.
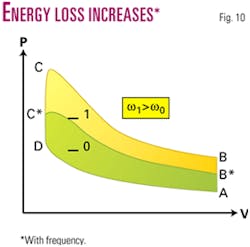
The process described above is only correct if the frequency is very high and, therefore, no heat exchange takes place during the compression cycle (transition between state B and C). At the lower frequency, the expansion cycle (transition between state D and A) is still isothermal because the pore wall is still moving faster than the speed of sound in gas. But during the compression cycle the heat exchange cannot be neglected any more.
The increase in heat exchange results in less work invested in gas compression. This means that the B-C trajectory on the PV diagram (Fig. 9) is lower than the perfect adiabatic trajectory. So, the loss of energy (or the area inside the A-B-C-D-A contour) is decreasing with the decreasing frequency (Fig. 10). With the decreasing frequency, the compression stage (B*-C* trajectory) is getting closer to isothermal process (D-A trajectory) and therefore is positioned under the perfect adiabatic process (B-C trajectory) on the PV diagram. Hence, the energy loss (the area inside A-B*-C*-D-A contour shown in Fig. 10) is decreasing with the decreasing frequency.
Since the heat exchange is linear with the speed of the pore wall and the speed of the wall is linear with frequency, the energy loss is also linear with frequency. This means that the energy loss ΔEG during one period (compression-decompression cycle) is proportional to frequency.
Assuming that the sound wave energy EW is independent of frequency, which is always the case for an impulse source of energy, we can conclude that the relative energy loss during one cycle is also proportional to frequency.
null
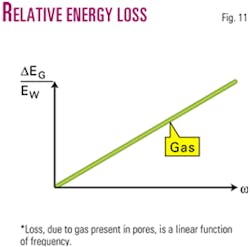
where ωref is the reference frequency (usually 1 hz), and QG is the coefficient of proportionality which we term the attenuation factor. Fig. 11 illustrates the linear dependence of the relative energy loss ΔEG/EW in a gas-filled pore to frequency.
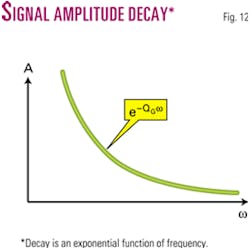
What follows from equation 7 is that due to the energy attenuation caused by gas filling the pore space, the signal amplitude is decaying exponentially as a function of frequency (Fig. 12).
The attenuation factor QG is independent of frequency and is a function of certain lithological properties (such as porosity, gas-saturation, geopressure, etc.) of rock. Provided that these properties are known, it is possible to estimate QG within the framework of this attenuation model. However in order to detect the presence of high gas-saturation from seismic data itself, it is sufficient to know that QG is increasing with (a) reservoir thickness and porosity and (b) with gas-saturation. Or, in other words, QG is proportional to the bulk volume of gas.
Energy attenuation in pores partially filled with liquid
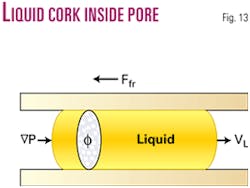
For the sake of simplicity and clarity of illustration, we will model the liquid inside the pore space in a shape of the "cork" shown in Fig. 13.
The cork is loosely connected with the pore wall and can be moved along the wall by the pressure gradient ∇P in the surrounding rock. The friction force Ffr between the moving liquid and the pore wall causes part of the mechanical energy to be irreversibly transferred to heat. Usually the process of liquid moving inside pore space under the force of sound wave pressure gradient is called a squirt flow.
The mechanism of energy conversion to heat due to friction is quite complicated and depends on a few unknowns (such as cross section of the pore, density and volume of the liquid cork, surface of contact with the pore wall, etc.). On the other hand, the mechanism of the energy transfer from the sound wave pressure gradient into the mechanical energy of the cork of liquid is much simpler and can be analyzed quite accurately.
Physically, these two approaches are equivalent because all the mechanical energy transferred to the liquid cork is converted to heat due to the friction with the pore wall. If this were not so, the liquid in the pore will keep on accelerating until the structural integrity of the rock is destroyed. Clearly this is not the case.
So, to estimate the amount of energy converted to heat we will analyze the mechanism of energy transfer from the sound wave to the mechanical energy of the liquid cork. The force pushing the cork is equal to the product of pressure gradient ∇P, caused by the sound wave, and the cross section φ of the pore (Fig. 13). Under the action of this force the cork starts to accelerate and the friction force Ffr is generated in response to the movement of the cork along the wall of the pore.
This friction force is proportional to the average velocity vwL of the cork relative to the pore wall. On the other hand, the kinetic energy of the cork is equal to the product of the average velocity and the impulse ζ transmitted to the cork by the wavefield force over one period (cycle) time interval.
null
where mL is the mass of the cork.
The transmitted impulse ζ is equal to the integral of the pressure gradient force φ∇P over one period of the sound wave:
null
Using expression 6 for the pressure field, we can compute the transmitted impulse.
null
where k‡ is the wave number, and C(v) is the phase-velocity of the sound wave.
Then, using equations 8 and 10, we obtain the amount of energy converted to heat over one period time duration:
null
Equation 11 leads to a very interesting conclusion. The relative energy attenuation ΔDEL/EW due to a squirt flow is inversely proportional to the phase-velocity of sound:
null
Following Aki & Richards,10 the phase-velocity approximation for the seismic frequency range is given by the expression:
null
where ωref is the reference frequency (usually 1 hz) and D is the dumping coefficient.
Substituting expression 13 into 12 and grouping all constants together we obtain the equation for the relative energy loss:
null
where QL is the attenuation factor of the liquid fraction component.
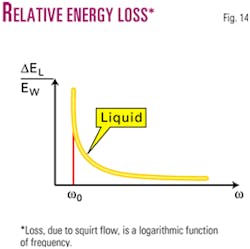
Fig. 14 illustrates the logarithmic decrease with frequency of the relative energy loss ΔDEL/EW in a pore partially filled with liquid. It means that the energy loss in liquid is much higher at low frequency as compared to the energy loss at high frequency.
The physical interpretation of this conclusion is intuitively clear. The energy conversion to heat is proportional to the displacement of the liquid cork within the pore. At the higher frequencies the cork just does not have enough time to move at any significant distance. Hence the energy loss is decreasing with the increasing frequency.
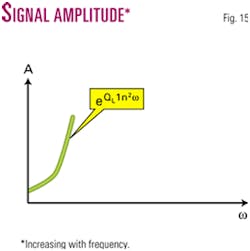
What follows from equation 14 is that due to the energy attenuation caused by the squirt flow of liquid trapped in pores, the signal amplitude is increasing with frequency (Fig. 15).
Similar to the gas-filled pores, the attenuation factor QL is independent of frequency but strongly depends on certain lithological properties (such as permeability, porosity, liquid density and saturation, geopressure) of earth. Provided that these properties are known, it is possible to estimate QL within the framework of this attenuation model.
However in order to detect the anomalously high presence of liquid from seismic data itself, it is sufficient to notice that QL is increasing with permeability and decreasing with density of liquid. Due to QL dependence of density it is, in principle, possible to distinguish between oil and water based on the attenuating properties of the partially saturated rock.
WEA analysis
At this point we know the energy attenuation law in both gas- and fluid-fraction. We also know that the attenuation properties are encoded into the energy spectrum of the wavelet, and we know how to extract the wavelet from the seismic signal based on the attenuation properties of the earth itself.
Now the question is: how to extract the gas and liquid attenuation factor from the wavelet? And, most importantly, are the attenuation effects measurable within the seismic frequency range (0 to 500 hz)? To answer these questions, let us consider the following chain of logic.
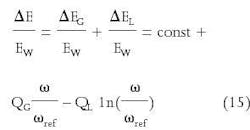
The total relative energy loss is the sum of the relative energy loss due to the gas fraction (equation 7) and to the liquid fraction (equation 14).
null
Equation 15 immediately leads to a very interesting conclusion that the frequency at which the minimum relative energy loss takes place is equal to the ratio of the liquid attenuation factor QL and the gas attenuation factor QG.
null
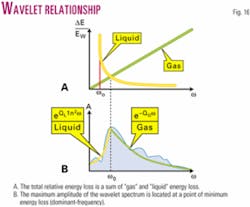
But the minimum energy loss signifies that the maximum energy of the wavelet is transmitted through the rock. Hence vd is the dominant frequency of the wavelet amplitude spectrum (the frequency position of the maximum amplitude). The relation between the total relative energy loss and the amplitude spectrum of the wavelet is shown in Fig. 16.
Now it is possible to answer the question whether we are within seismic frequency range. From equation 16 it follows that if the dominant frequency of the wavelet spectrum is within seismic frequency range then the attenuation mechanisms for both gas and liquid produce the most prominent effect within this range.
From numerous observations and analyses of seismic data we know that this is definitely the case. In fact, in most of the cases the wavelet dominant frequency is between 8 and 32 hz, which is well within the range of recorded seismic frequencies.
The next question is: how to extract the gas and liquid attenuation factor from the wavelet? Looking at Fig. 16 we can conclude that:
a. The energy attenuation due to the squirt flow of the liquid is the prevailing process in the zero- to dominant-frequency range.
b. The energy attenuation due to the gas compression-decompression mechanism is the prevailing process in the dominant- to maximum-frequency range.
This observation naturally leads to the following sequence of steps for extraction of QL and QG from the amplitude spectrum of the wavelet.
1. Find the frequency at which the amplitude of the wavelet spectrum is maximal (dominant frequency).
2. Find QL by performing an exponential least-square fit into 1nω in the zero- to dominant-frequency range.
3. Find QG by performing an exponential least-square fit into v in the dominant- to maximum-frequency range.
The outputs of this process are two independent measurements: QL and QG· QL is sensitive to the presence of liquid (oil, water) in the permeable rock whereas QG is indicative of gas and porosity.
The knowledge of these two attenuation factors, though, is not sufficient for the purpose of direct hydrocarbon detection. We also need to detect and remove the background attenuation caused by scattering and many other unknown reasons and to get the location (in space and travel-time) of the anomalously high values of QL and QG.
But before we can proceed with the detection and elimination of the background-attenuation we need to compensate for the damaging influence of velocity dispersion phenomenon on attenuation measurements.
Velocity dispersion compensation
The ability of rock to attenuate seismic energy is not the only factor that affects the spectrum of the wavelet.
As shown in Aki and Richards,10 the energy attenuation phenomenon necessarily leads to the conclusion that the phase-velocity of sound depends on frequency. This effect is called velocity dispersion.
Since the energy attenuation and the phase-velocity dispersion phenomena are interconnected, they both affect the wavelet, but these effects are different. It has been previously shown how energy attenuation changes the spectrum of the wavelet; so now let us analyze the effect of velocity dispersion.
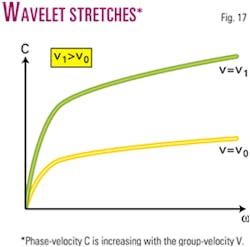
Shown in Fig. 17, phase-velocity C of sound is increasing with the increasing velocity V of the wavelet center (or group-velocity). This means that, with increasing group-velocity, the phase-velocity of the high-frequency end of the wavelet is increasing faster than the phase-velocity of the low-frequency end of the wavelet.
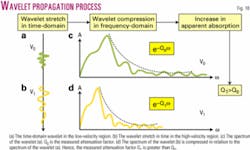
Consequently, when the wavelet propagates from a region with low group-velocity, V = V0, into a region with high group-velocity, V = V1 (V1...V0), it stretches in space. This stretch of the wavelet in space is equivalent to the wavelet stretch as a function of its two-way travel time.
Fig. 18 illustrates the process of the propagation of wavelet from the low-velocity region (Fig. 18a) into the high-velocity region (Fig. 18b). The consequence of the wavelet stretch in time-domain is that the spectrum of the wavelet is compressed in frequency-domain (Figs. 18c and 18d).
Therefore, the measured attenuation factor (either "gas" or "liquid") is increased in value. But this increase in apparent attenuation does not signify the presence of either gas or liquid in the pore space, it simply reflects sudden increase in the group-velocity of sound.
The damaging effect of the velocity dispersion phenomenon is especially strong when the relatively high-velocity carbonate or igneous rocks are imbedded into relatively low-velocity clastic layers. In cases like this, the velocity contrast (from clastic to carbonate) is very high and, therefore, computation of attenuation factors can produce false anomalies in carbonates.
At first glance, the resolution of this situation seems to be hopeless. The instantaneous group-velocity in rock is not known, but, even would it be known, we still cannot compute a reliable estimate of the corresponding degree of wavelet stretching or compression in the frequency-domain.
The solution to this problem is actually quite simple. Notice that the velocity dispersion phenomenon does not cause a change in the rate of energy attenuation. The strongest effect of the velocity dispersion is in stretching or compression of the wavelet spectrum.
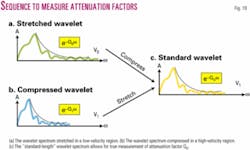
We can use this observation to our advantage, namely, we can force the wavelet spectrum to be a constant length regardless of how long the actual spectrum is (Fig. 19). Then, if the wavelet spectrum is too long, we will artificially compress it to a certain predefined length; or if the wavelet spectrum is too short, we will correspondingly stretch it to the same constant length.
Since the actual rate of energy attenuation is not changed by the velocity dispersion phenomenon, this stretch/ compress operation reveals the true picture and allows for accurate extraction of attenuation factors from this "standardized-length" wavelet spectrum.
After the velocity dispersion compensation is done we are ready to detect and remove the background attenuation.
Traveling wavelet and background elimination
During sound wave propagation through the substrata, the wavelet is continuously changed by the lithological properties of the earth.
In particular, the spectrum of the wavelet is sensitive to all kinds of energy attenuation mechanisms; spherical divergence, scattering on small heterogeneities, squirt flow, gas compression, etc.
On the other hand, we know that earth is not full of liquid and gas even though a certain amount of both is always present in the pores space of the rock structure. So, what we need is not just values of the attenuation factors QL and QG but the locations where either one is significantly above the background level of energy attenuation.
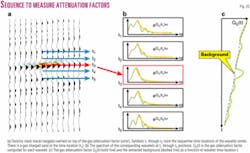
Fig. 20 illustrates the sequence of steps performed in order to achieve this goal.
First, the wavelet is extracted from the short time-window centered at every time-sample (two-way travel time) of the seismic trace (Fig. 20a). The liquid and gas attenuation factors are computed for each of the extracted wavelets. Fig. 20b shows the example for gas attenuation factor. Note how different the spectrum of the wavelet is at the gas-location (t3).
Exactly in accordance with the theory of attenuation-based wavelet extraction discussed earlier, it is much smoother than the spectrum of the wavelets above and below. Also its amplitude is decaying noticeably faster for frequencies higher than the dominant-frequency, which signifies the anomalously high value of the gas attenuation factor.
In the last step (Fig. 20c), the background attenuation factor is extracted independently from each of the computed attenuation factors (gas and liquid) and subtracted from the corresponding original value of Q. Physically, this background, as well as the attenuation factor itself, is the function of the wavelet propagation path (or ray path).
The postmigrated seismic image is composed of stacked seismic traces. Each trace represents the seismic signal recorded along one normal-incidence propagation path. Hence, the attenuation factor and the corresponding background should be computed for each trace independently.
Since no lateral considerations and averaging are needed for this algorithm, the computational procedure is greatly simplified. On the other hand, the reliability of the method significantly depends on the accurate and stable wavelet extraction from a very short time-window.
Would seismic data be recorded in analog continuous form, the short time-window manipulations would not be a problem. But since we have to deal with the digital data, that is where the physics ends and the signal processing begins.
Signal processing
Using the attenuation-based deconvolution (PID) method, we can extract the wavelet directly from the spectrum. So basically, once we know the spectrum, we know the wavelet.
The quality of the extracted wavelet is entirely defined by the reliability and the stability of the spectrum computed on a short time-window (or instantaneous spectrum).
The most natural way to compute the spectrum of the digital signal is the so-called Fast Fourier Transform method (FFT). The quality of such computed spectrum depends on the number of signal samples included into computations.
The problem of computing spectrum on the short time-window is that this window does not contain enough samples for reliable application of the FFT procedure. So the direct application of FFT to the short time-window does not produce the desired result. Hence, either the procedure or the digital signal itself has to be modified.
Presently there are two basic methods for instantaneous spectral decomposition: the Short Window Fourier Transform (SWFT) and multiple variations of the wavelet transform (WT) method. There are arguments in favor of each of these methods, but both suffer from the Heisenberg uncertainty principle. That is, the product of the temporal localization error Δt and the frequency localization error Δω is constant for all possible combinations of time-window and the frequency scale.
null
The primary difference between the methods is how small this localization constant can be made.
From the sampling theorem, it follows that the lower limit of Δt is constrained by the half of the instantaneous wavelength and the lower Δω limit is set by the maximum window length. These considerations allow an expansion of the SWFT method to the maximum resolution of the digital seismic data.
The typical scale of the gas or oil reservoirs requires the time-window size between 8 and 80 msec. A window of this size does not contain enough signal samples to reliably compute the spectrum using the conventional FFT. This suggests some kind of interpolation of the entire seismic trace prior to the application of the windowed FFT.
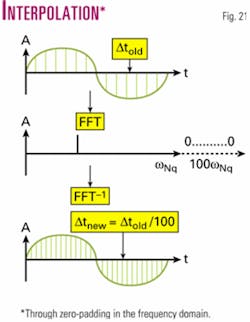
The interpolation procedure has to be frequency-domain invariant. That is, the spectrum of the interpolated trace should be equal to the spectrum of the original trace. This interpolation can be accomplished by zero-padding of the original spectrum to the desired Nyquist frequency (Fig. 21).
The inverse FFT will result in decreasing of the sampling rate Δtnew in proportion to the new expanded Nyquist frequency. But, because the spectrum is not changed, the new time samples will represent the same combination of monochromes as the original signal. This is the linear procedure, and it works precisely for one monochromatic function. Hence it works for any linear combination of monochromatic functions and, therefore, works for any digital signal.
The application of the described interpolation procedure to the entire seismic trace results in the desired increase of number of samples without changing the overall spectrum of the trace. The number of samples within the short time-window will increase accordingly and consequent use of the FFT on this window produces the stable and reliable spectrum of the windowed signal.
The entire trace interpolation is necessary but not sufficient for the goal of instantaneous spectral decomposition. The window on the interpolated trace has enough samples to use FFT, but the computed spectrum spans the range between zero and new Nyquist frequency, whereas the useful signal is still localized between zero and old Nyquist.
Hence, even though we have enough frequency samples within the entire frequency-range, the number of samples within the useful frequency range is not sufficient to obtain the stable attenuation factor computation.
Therefore, frequency-domain interpolation has to be applied to the extracted window. This second step interpolation is accomplished by the same means as the first step with the difference that zero-padding is applied in the time-domain of the extracted window prior to the computation of the window spectrum using FFT procedure.
Next: The WEA method and four examples of its use.
