Global demand for LPG drives US exports to record highs
Dan Lippe
Petral Consulting Co.
Houston
As the coronavirus (COVID-19) evolved into a global pandemic, consequences for US midstream companies were starkly different for those on the supply side of the business than those the demand side. As NGL supply from international sources declined and prices increased, demand—especially for petrochemical feedstock—remained steady, with prices and margins for important petrochemical products like polyethylene and polypropylene also holding strong. When prices for primary products are robust and rising, and profit margins for one’s most important customers are even better, the conclusion is difficult to dispute: the pandemic translated into good business for North American midstream companies, particularly those in the business of meeting international demand.
After swiftly recovering from an unprecedented winter deep freeze and subsequent power outages in February-April 2021, crude oil and natural gas producers in the Gulf of Mexico, Texas, and Louisiana experienced only limited downtime during the 2021 Atlantic storm season until Hurricane Ida’s Aug. 29 landfall in southeast Louisiana. Extended outages to regional power supply in the hurricane’s aftermath forced ethylene plants and refineries throughout the New Orleans-area Mississippi River corridor (NORC) into several weeks of downtime.
US Energy Information Administration (EIA) weekly statistics showed US Gulf Coast (USGC) refinery crude runs were 8.6 million b/d in the 4 weeks leading up to the last week of August and fell to 6.95 million b/d in the first 2 weeks of September.
EIA does not provide breakout data for Louisiana crude runs in its weekly reports but provides statistics for crude runs for all refineries in Louisiana in its monthly reports. Crude runs in Louisiana are typically 2.8-3.1 million b/d in July and August. Hurricane Ida reduced refinery operations in September by 1.65-1.70 million b/d (-56%) for 2 weeks.
Based on Petral Consulting’s monthly survey of ethylene plant operating rates, ethylene production from plants in the NORC (January-August 2021) was 33-37 million lb/day and averaged 35.4 million lb/day. Production fell to 14 million lb/day in September and production was 60% less than in the previous 8 months. As is usually true when hurricanes cause extensive power outages, refineries and ethylene plants experienced similar downtime periods. Downtime for refineries and ethylene plants is critical for NGL producers because both are large NGL consumers.
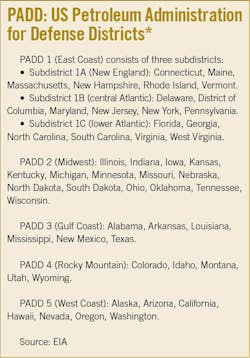
Natural gas production in North America from pure gas-play fields and reservoirs, during 1970-2010, was the primary driver for NGL supply in North America. As crude oil producers began applying horizontal drilling and high-pressure hydraulic fracturing technology to oil prone shale plays, crude oil and associated gas production became the primary drivers for gas plant NGL production from 2010to 2020. NGL production in the USGC (PADD III) has exceeded forecasts made in first-quarter 2021.
This article series, from its inception in 2005, has focused on trends in domestic NGL supply from gas processing plants and NGL disposition in domestic markets. As US propane and butane supply increased beyond the consumption capability of the domestic markets, a few of the major integrated midstream companies retrofitted existing import terminals to increase export capability and constructed new LPG export terminals to keep pace with the growing surpluses of propane and butane. This article, at least once a year, will now provide equal emphasis on developments in international LPG supply, LPG prices in critical regional markets and US LPG exports as well as the traditional focus on domestic market trends.
LPG supply balance, export markets
While North American producers historically have been the largest suppliers of NGLs to global markets, expansion of gas gathering and processing infrastructure by oil producers in the Middle East in 2000-15 reduced flaring associated gas and increased non-North American LPG production by nearly 75%. Trends in LPG production, however, do not directly translate into LPG exports.
Kuwait, Qatar, Saudi Arabia, and the United Arab Emirates account for 80% of total Middle East LPG production. These four countries are also the largest LPG exporters, with Qatar and Kuwait having the least internal demand for propane and butane.
While Saudi Arabia, the Middle East’s largest oil and gas producer, also has been the region’s largest supplier of LPG for more than 40 years, ongoing expansions to the Saudi Arabian petrochemical industry since the early 1970s—including increased feedstock flexibility of its ethylene plants—has also resulted in Saudi Arabia consuming more LPG production internally than all other regional producers combined.
Petral Consulting Co. estimates show Saudi Arabia’s internal markets absorb about 70% of its LPG production, while internal markets in Kuwait and the UAE absorb less than 10% and 20%, respectively. Qatar also absorbs less than 10% of its LPG supply to meet internal demand, but this LPG mostly comes from processing nonassociated gas volumes produced at the country’s massive North field.
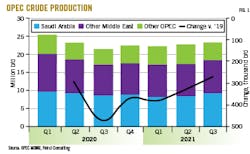
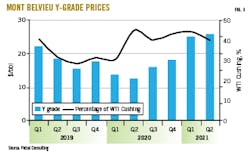
While LPG exports from Kuwait, Saudi Arabia, and the UAE fell 15-20% in second-half 2020 and first-half 2021 as they implemented Organization of Petroleum Exporting Countries (OPEC)-mandated crude production curtailments, Qatar’s LPG production and exports remained nearly constant during the period. OPEC Monthly Oil Market Report (MOMR) historical data showed oil production for the four key LPG producers was 17.0-17.5 million b/d in 2019. In compliance with OPEC’s curtailment agreement, production fell to just shy of15.0 million b/d in second-half 2020 and remained at this level in first-half 2021 (Fig. 1). Petral Consulting estimates LPG production from the four producers was 2.78 million b/d in first-half 2020 but fell to 2.45 million b/d in third-quarter 2020 and 2.3 million b/d in fourth-quarter 2020, with production in fourth-quarter 2020 and first-half 2021 down 0.45-0.55 million b/d down from fourth-quarter 2019 and first quarter 2020, respectively.
All Middle East producers have some internal markets for LPG as either feedstock or to supply traditional retail markets. Since the COVID-19 lockdown had little to no impact on demand for LPG for consumption in the retail fuels market or as feedstock for petrochemical plants, internal demand in the Middle East remained constant while production declined.
Petral Consulting estimates LPG exports from the four major Middle East exporters in second-half 2020 and first-half 2021 were down 450,000-550,000 b/d from second-half 2019. Propane’s share of reduced LPG exports was 270,000-350,000 b/d (60-65% of total LPG volumes). Estimates of exports from global producers are based on typical NGL composition for gas processing plants in Texas-New Mexico.
The reduction in propane supply from primary suppliers in the Asia Pacific and the Middle East had two predictable consequences. First, buyers in the Asia Pacific advised Houston suppliers of the need for more propane exports, notifying shipping companies to reroute LPG vessels from the Persian Gulf-Asia Pacific shipping route to the USGC-Asia Pacific route. Since the distance from Houston to Tokyo and other major ports in the Asia Pacific northeast is greater than from the Persian Gulf, transit times for marginal LPG supply increased alongside rising freight rates. Finally, as is often true when propane supply circumstances change abruptly and unexpectedly, prices also change substantially.
While many in the industry continued to tell themselves the COVID-19 pandemic would be resolved by mid-2021, buyers in the Asia Pacific took no chances and instead ramped up LPG purchases from the USGC. US propane exports to the Asia Pacific—which in 2019 were 563,000 b/d—increased to 712,000 b/d in second-half 2020 and 709,000 b/d in first-half 2021. If West Texas gas plants had been in full service in February-April 2021 and power outages had not disrupted fractionation, storage, and export terminal operations, exports in first-half 2021 would have exceeded second-half 2020 exports. In support of this view, propane exports to the Asia Pacific northeast were 778,000 b/d in May-July 2021, when the reality of the persisting pandemic began displacing the unrealistically optimistic view that COVID-19 would soon be a thing of the past.
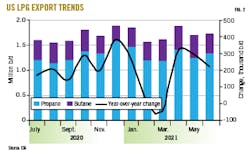
While propane exports from all US LPG terminals in second-half 2020 were up 27.7 million bbl from the 2019 average, US exports levels in January-July 2021 were 33.5 million bbl above average exports in 2019 (Fig. 2). This comparison to the 2019 average export level is important because US propane production (gas plants + net refinery propane) increased only 72,000 b/d in 2020 and is unlikely to increase more than 70,000-75,000 b/d in 2021 vs. 2020. In first-half 2021, US propane exports to all destinations from all terminals were 95,000 b/d and 219,000 b/d higher than 2020 and 2019 full-year averages, respectively.
Propane, as usual, got the lion’s share of publicity during mid-2020 through mid-2021, but US butane exports (normal butane + isobutane) were also notably higher between July 2020-June 2021 at 399,000 b/d, 73,800 b/d (26.9 million bbl; 22.7%) more than in the previous 12 months.
Consistent with declining LPG exports from the Middle East and rising US exports, propane inventory-build rates in USGC storage were below their 3-year averages in 17 of 25 weeks (first week of April-third week of September). Based on EIA monthly statistics, USGC inventory in storage on July 1, 2021, was down 16.7 million bbl (36.5%) from 2020, with EIA weekly inventory data showing a year-over-year deficit of 21 million bbl (38%) by Sept 1, 2021.
EIA monthly statistics also showed normal butane inventory in USGC storage on July 1 was 8.3 million bbl (23%) lower from 2020. Propane inventory typically continues to build through late October and sometimes into mid-November. In contrast, normal butane inventory almost always peaks in late September.
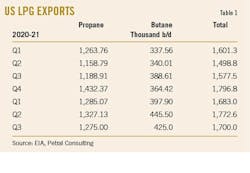
Table 1 shows actual and estimated US LPG exports, first-quarter 2020 through third-quarter 2021.
If Middle East propane supply stays below prepandemic volumes, supply anxiety will remain an important influence on buyers’ perceptions for winter 2021, with upward pressures remaining persistent and strong for both propane and normal butane.
Middle East, Mont Belvieu LPG pricing
From the early days of the pandemic, Middle East producers understood demand for transportation fuels was not recovering as quickly as the prevailing optimistic view implied. Nevertheless, the Middle East’s four LPG exporters held oil production constant at 14.7-14.9 million b/d in first-half 2021, which increased to 15.5-15.9 million b/d in third-quarter 2021 (vs. 16.8-17.1 million b/d in second-half 2019). Industry media sources regularly publish articles on crude production for all Middle East countries but rarely report on NGL production. When Middle East producers restrict crude production, however, LPG production based on processing associated natural gas also declines. While these same industry and mainstream media sources issue daily reports on crude prices, they provide very little coverage of LPG prices.
OPEC, in late-April 2021, announced its intention to increase oil production limits by 4 million b/d in May-July. OPEC’s short-term production plan was based on expectations of a sustained recovery in demand for transportation fuels and increasing refinery crude runs. OPEC’s policy makers also announced in April oil production limits would rise monthly by a maximum of 500,000 b/d. This qualification reinforced upward pressure on oil prices.
As these policy changes were implemented, crude, transportation fuels, and petrochemical feedstocks prices increased in domestic and international markets. During April-July 2021, crude oil prices rose $9-11/bbl (9-11%), gasoline prices increased 12-15%, and propane prices in Mont Belvieu and Conway increased 34% and 44%, respectively.
Propane prices increased more than prices for crude and transportation fuels for a couple of reasons. Consistent with demand seasonality in space-heating markets, total propane demand in retail markets in April was 55-65% less than in January-February, leaving Mont Belvieu spot prices 11.6% lower in April and were nearly unchanged in May. Additionally, as space heating demand declined in March-April, US and international LPG traders, US propane wholesalers, and US NGL marketing managers based their offseason plans for trading, marketing, and supply on expectations that propane inventory would increase to a seasonal peak of 82-85 million bbl by Oct. 1, 2021. Inventory build rates in May-June, however, were 6 million bbl (35%) below the 2015-19 average. International and domestic traders, US propane wholesalers, and US NGL marketing managers realized if US propane inventory build rates were persistently below average, peak inventory would be 20-30 million bbl less than in 2019 and 2020.
In the international LPG market (excluding North America), Middle East producers control the largest concentration of LPG supply and exports. Saudi Aramco sets LPG contract prices (CP), with all other Middle East producers basing contract LPG sales on Aramco CPs. In fourth-quarter 2019, Middle East CPs for propane were 82¢/gal, 55% of the OPEC crude reference basket (ORB) price.
In the first 3 months of the pandemic, Aramco—realizing LPG buyers in the Asia Pacific were already anticipating reducing LPG supplies from the Persian Gulf by as much as 25%—increased propane CPs to 108¢/gal in January 2020 (70% of ORB) and set CPs for February 2020 at 97¢/gal (73% of ORB). Although crude and LPG prices declined in second-quarter 2020, Aramco reduced propane CPs more slowly than spot crude prices, with the propane CP set at 102-106% of ORB prices March-May 2020. During this 3-month period, crude spot prices were abnormally weak.
When Saudi Arabia convinced all members to make the major production cuts implemented in May 2020, Aramco also increased the propane CP relative to Arab Light crude. Aramco’s baseline price objective for LPG exports is 90% BTU parity vs. Arab Light crude. In fourth-quarter 2019, the propane CP was discounted by 4.8¢/gal vs. the BTU basis value. From first-quarter 2020 through third-quarter 2021, Aramco consistently set the propane CP at premiums to BTU basis values. Premiums were 8.6¢/gal in third-quarter 2020 and 20.3¢/gal in fourth-quarter 2020 before jumping to 35¢/gal in first-quarter 2021.
After winter 2020-21 ended, spot prices in Mont Belvieu, Tex., fell to 80-85¢/gal in April from 92-95¢/gal in March. Prices for spot propane cargoes in the Middle East fell to 90-95¢/gal in April but began increasing in May to reach 130¢/gal in September.
As the first COVID-19 vaccines were delivered and millions vaccinated, the view that a prompt end to the pandemic was at hand became the norm, raising the expectation that demand for transportation fuels would recover to prepandemic levels by yearend.
Based on this view and buyer resistance in Asia Pacific chemical feedstock markets, Aramco reduced propane CP premiums to 5.2¢/gal above the BTU basis value in April 2021 before increasing it to 7.2¢/gal in May. As expectations of a full recovery in global demand for transportation fuels waned, crude oil traders and refinery crude buyers realized OPEC would continue to limit crude production rates. Since oil production curtailments continued to limit LPG production, Aramco increased the propane CP to 127¢/gal in September 2021 (73% of ORB prices).
Propane prices in Mont Belvieu were 80¢/gal in early May, 49-51% of West Texas Intermediate (WTI). Prices began increasing in mid-May, however, to reach 110¢/gal (65% of WTI) in mid-July. By late September, spot prices were 130-135¢/gal (77-79% of WTI).
While EIA collects data on propane inventory held in primary storage sites, it does not collect statistics on inventory in secondary or tertiary storage. Primary storage includes sites open to all producers, traders, marketers, and consumers who are credit worthy and meet all basic requirements. All salt caverns in Mont Belvieu, Conway, Kan., Hattiesburg, Miss., and elsewhere are defined to be primary storage. All aboveground storage tanks operated by LPG pipeline companies and all standalone storage tanks with capacity of 100,000 bbl or more are also defined as primary storage.
Spot prices in Mont Belvieu were 35-36¢/gal (70-72% of WTI) in June-July 1996. In the panic-buying episode that followed the August 1996 explosion of state-owned Petróleos Mexicanos’ (Pemex) 1.45 bcfd Cactus gas plant in Tabasco, Mexico, propane prices in Mont Belvieu reached 50-55¢/gal (87% of WTI) in October and 58-65¢/gal (100-105% of WTI) in November-December. The loss of propane supply after the Cactus plant exploded was 40,000 b/d. The current propane inventory deficit is equivalent to a production loss of 140,000 b/d.
In 1996, ethylene producers were running record-high volumes of propane, but reduced propane demand by 40,000 b/d within the first few weeks of the price spike. As prices continued to rise, ethylene producers continued to reduce their propane consumption. Within 8 weeks, ethylene producers reduced propane demand by 100,000 b/d. Propane consumption as ethylene feedstock declined 2.5 times more than required to offset the loss of supply from the Cactus plant.
In third-quarter 2021, propane demand as ethylene feedstock was 250,000 b/d. Based on previous price spikes, ethylene producers have the potential to reduce propane demand by 50,000 b/d. If propane prices increase to 1996 levels in winter 2021, a few ethylene producers may simply shut down plants until prices return to acceptable levels.
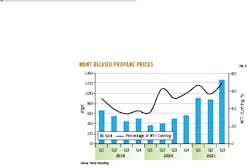
Whether Middle East oil producers continue limiting production by 2 million b/d or more October 2021-January 2022 will determine how strong propane prices in Mont Belvieu are likely to be November-January. Based on WTI prices at $70-75/bbl and using the record-high for propane as a percentage of WTI (68¢/gal at 100% of WTI in December 1996 and 76-78¢/gal at 108-116% of WTI in December 2000-January 2001, Petral Consulting estimates Mont Belvieu propane prices could reach 170-200¢/gal. If Middle East producers continue to limit crude and LPG production, global propane supplies will remain tight, adding continued upward pressure to pricing (Figs. 3-4).
US gas plant NGL supply
In response to reduced sales to both domestic and international refineries amid the pandemic, US oil producers voluntarily reduced oil production. The US oil-directed rig count began declining in fourth-quarter 2019, with the rate of decline accelerating in second-quarter 2020 when oil prices briefly fell below $20/bbl. Oil exploration activity collapsed, and producers curtailed oil-directed drilling in all major US shale plays. As production growth rates from major shale plays (Permian, Eagle Ford, Bakken, DJ Basin, and Anadarko-Woodford) slowed, most industry sources anticipated US NGL production would also begin to decline.
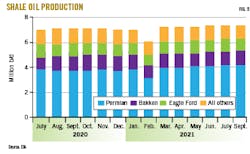
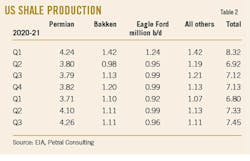
EIA provides a breakout of monthly US oil production for each of the major shale plays (Fig. 5). In first-quarter 2020, production from all shale plays totaled 8.3 million b/d, up 1 million b/d from first-quarter 2019. As US and international refineries began cutting crude runs in response to the global collapse in demand for transportation fuels (gasoline, diesel fuel, and jet fuel), some domestic oil producers reduced production to avoid driving global crude inventories to unsustainable levels and prolonging the period of deeply depressed oil prices. US crude production from shale plays fell below 7 million b/d in second-quarter 2020 before recovering to 7.12 million b/d in third-quarter 2020 and 7.13 million b/d in the fourth quarter.
If the Electric Reliability Council of Texas (ERCOT) had been better prepared for the impact of severe cold weather that engulfed Texas in February 2021, oil production from shale plays, likely, would have remained flat in first-quarter 2021 instead of falling as evidenced a second-quarter 2021 production of 7.33 million b/d, which was up 530,000 b/d from first-quarter 2021 and 200,000 b/d more than in fourth-quarter 2020.
Before the first-half 2020 collapse in oil prices, US producers were running just over 500 rigs in the major shale plays. Private equity firms, however, had already shifted their expectations from “grow oil production as fast as possible” to “increase profit margins and return profits.” In the new economic environment, the rig count had already started to decline but the combination of the pandemic, the collapse in demand for transportation fuels, and the crash in oil prices in second-quarter 2020 accelerated the fall.
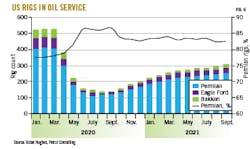
As in 2014-15, the oil-directed rig count in shale plays fell by about 70% during April-August 2020, after which it began a gradual recovery to reach 400 rigs in service in August-September, leaving 270 less rigs in service than in first-quarter 2020. Based on oil production in Texas-New Mexico, the recovery is likely to be strong enough to support moderate growth in oil production in the Permian basin, especially in southeast New Mexico. As has been true since 2015, Permian oil production is critical to growth prospects for propane+. Since January 2020, the Permian oil-directed rig count has accounted for 82-85% of rigs of the three major US shale plays.
Fig. 6 shows rig counts for the three major US basins from January 2020 to September 2021.
In second-quarter 2021, Permian production recovered to 4.1 million b/d and is on track to exceed production in first-quarter 2020 production levels by yearend (Table 2). Production in other major shale plays has recovered more slowly and will not exceed first-quarter 2020 production levels until at least second-half 2022, if even then.
The trend in gas plant production of propane, butane, and natural gasoline (propane+) is the best aggregate measure of the underlying strength or weakness in US NGL supply. Although crude oil production is the primary driver for associated gas production, associated gas production ratios vs. crude oil vary from basin to basin, as does NGL content (gal/Mscf).
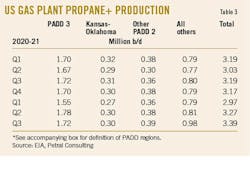
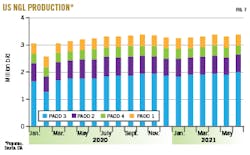
US propane+ production fell to 2.97 million b/d in first-quarter 2021, down 220,000 b/d from first-quarter 2020 (Table 3, Fig. 7). Power outages in all regions of Texas following the February 2021 freeze caused many gas plants to shut down for as long as 2 weeks. In second-quarter 2021, however, US propane+ output rebounded to 3.27 million b/d, up 240,000 b/d from second-quarter 2020. Propane+ production (all basins) is on track to average 3.35-3.40 million b/d in third and fourth-quarters 2021. By second-quarter 2022, production will reach 3.40-3.50 million b/d.
Ethane production, rejection
EIA reported total US gas plant ethane production was 2.0 million b/d in first-half 2021, averaging 99,700 b/d (5.2%) more than in first-half 2020. Ethane production from USGC gas plants was 1.260 million b/d in first-half 2021 and would have been 1.32-1.33 million b/d had not extensive power outages limited production to 931,000 b/d in February. Rejection in the USGC was 332,000 b/d in first-half 2021, up 67,000 b/d (39.5%) from second-half 2020.
Ethane production from gas plants in the Rocky Mountains (primarily Colorado-Wyoming) was 155,400 b/d in second-half 2020, 32,000 b/d (26%) higher from first-half 2020. Ethane rejection in the region during second-half 2020 was 155,000 b/d, down 32,000 b/d from first-half 2020 and equal to 44.2% of full recovery in third-quarter 2020 and 56.1% in the fourth quarter.
In Kansas-Oklahoma, ethane production for second-half 2020 was 231,000 b/d, up 16,200 b/d (7.6%) from first-half 2020. Regional gas plants ran at 90% of full recovery in the third quarter before slipping to 83% recovery in the fourth quarter. These plants rejected 27,000 b/d of ethane in the third quarter and 44,600 b/d in the final quarter.
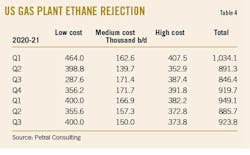
Petral Consulting estimates ethane rejection from all US gas plants in first-half 2021 was 851,000 b/d, just 24,300 b/d (14.3%) more than in second-half 2020 (Table 4).
Gas plants in the USGC, Kansas-Oklahoma, and Rocky Mountains are the most important ethane supply sources for Texas and Louisiana ethylene plants. USGC and Kansas-Oklahoma gas plants supply low-cost ethane, while plants in the Rocky Mountains are intermediate-cost supply sources, and plants in North Dakota, Ohio, West Virginia, and Pennsylvania high-cost supply sources.
When Saudi Arabian Basic Industries Corp. (SABIC) and ExxonMobil Corp. joint-venture Gulf Coast Growth Ventures LLC commissions its 1.8-million tonne/year (4-billion lb/year) ethane cracking complex in San Patricio County, Tex., near Corpus Christi, in fourth-quarter 2021 or first-quarter 2022, Petral Consulting estimates ethane demand will increase 110,000-130,000 b/d. Texas-New Mexico gas plants, as the low-cost sources of incremental supply, will reduce ethane rejection to 150,000-200,000 b/d in first-half 2022.
NGL market overview
Chemical markets (primarily ethylene industry demand) generally account for 75-80% of domestic NGL demand. NGL feedstocks also account for 95-96% of US ethylene production. Producers and consumers of crude and petroleum-derived products have long been aware they live in a very interconnected world. Events in local markets that are seemingly unimportant on a global scale often have immediate and major impacts on both crude and product markets, which in turn directly impact naphtha supply and prices. This is especially important for US NGL marketers because most ethylene plants outside North America rely on naphtha as their primary feedstock.
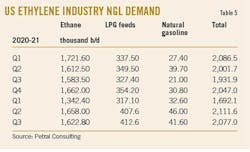
Ethylene producers recovered from a rocky start in first-quarter 2021 to produce 200-210 million lb/day in the second and third quarters. During May-August of this 6-month period, production was 215-220 million lb/day, 185-195 million lb/day in September, and 190-200 million lb/day in April. Between April-September, ethylene producers consumed 1.5-1.8 million b/d of ethane, 210,000-275,000 b/d of propane, 120,000-180,000 b/d of normal butane, and 25,000-45,000 b/d of natural gasoline. Overall demand for NGL feeds in second-quarter 2021 was 2.1 million b/d (Table 5). After Hurricane Ida caused power outages in southeast and central Louisiana in early September, Louisiana ethylene production fell to 40-44 million lb/day from 55-60 million lb/day in January-August.
The primary reaction to COVID-19 was government-imposed lockdown orders in most of the world’s major economies that encouraged many employers to allow staff to work remotely. Naturally, demand for the two primary transportation fuels (gasoline, diesel) fell 15-20%. One of the unintended consequences that received only limited attention was the reduction in the supply of naphtha feedstocks to ethylene plants in Europe and the Asia Pacific.
New variants (delta and lambda) of the basic COVID-19 virus emerged in June-July 2021 slowed recovery in global demand for transportation fuels. By August, delta was the predominant COVID-19 variant in North America, but many US consumers that had finally emerged from lockdown in May-June remained determined to take old-fashioned roadtrip vacations.
Analysis of EIA’s weekly supply statistics for motor gasoline and diesel fuel confirmed that gasoline demand was 99.6% of prepandemic volumes in July-September. Similarly, demand for diesel fuel was 100.6% of prepandemic volumes. Jet fuel, however, remained 18% below prepandemic levels. The recovery in gasoline demand bodes particularly well for normal butane demand during the winter RVP blending season.
Refineries in the USGC and US Midcontinent account for 75-80% of total crude runs for all US refineries, as well as account for 70-75% of total US gasoline production. Refinery demand for normal butane, isobutane, and natural gasoline is even more concentrated in these two regions. USGC and Midcontinent isobutane demand accounted for 81-83% of total US demand in 2019-20 before rising to 83-86% of demand in first-half 2021. Due to extensive refinery downtime in Texas during February-March, total US isobutane demand in first-quarter 2021fell to 168,000 b/d, down 36,000 b/d from first-quarter 2020 and 14,500 b/d from fourth-quarter 2020. In second-quarter 2021, total isobutane demand from all US refineries recovered to 194,000 b/d, up 24,000 b/d from the same period in 2020.
In winter 2020, normal butane demand for RVP blending reached its seasonal peak of 264,000 b/d in fourth-quarter 2020 before falling to 202,000 b/d in first-quarter 2021. USGC and Midcontinent demand in fourth-quarter 2020 was 198,500 b/d (75% of US demand) before slipping to 154,000 b/d (76% of US demand) in first-quarter 2021.
Gasoline production is the number one parameter that determines refinery demand for butanes and natural gasoline. Natural gasoline prices also have to be economic based on the value of octane in the wholesale gasoline markets in the USGC and Midcontinent. Octane values in second-half 2020 fell to 0.75-1.0¢/octane-gal vs. 2.0-2.5¢/octane-gal in 2018-19. Octane values in the USGC pipeline market recovered in March 2021, rising to 2¢/octane-gal in April-August. USGC and Midcontinent refineries also increased gasoline production by 1.16 million b/d in second-quarter 2021.
USGC and Midcontinent refinery demand for natural gasoline during first-quarter 2021 was 96,000 b/d, down 35,600 b/d from the 2018-19 average. In second-quarter 2021, demand increased to 122,000 b/d, higher than in any quarter in 2020. Now that US gasoline demand has recovered to 2019 levels and gasoline prices are strong, refinery demand is likely to average 120,000-140,000 b/d in second-half 2021 and first-half 2022.
Near-term outlook
First, let’s examine fundamental trends in the number of new cases of COVID-19, which first became a global pandemic within 6 months of the first reported cases in Wuhan, China. Based on 2020-21 global statistics aggregated by Worldometer, the number of daily new cases of COVID-19 increased to 842,600 cases in the first week of January 2021 (the first major peak). In the next 10-12 weeks, the number of new daily cases fell to 375,000 in late March. New cases, however, promptly increased to 876,000 in late May (the second major peak) before falling to 406,000 in early June. Notably, the second low was higher than the first low. By mid-August, daily new cases reached 746,000 (the third major peak) before dropping to 500,000 in late September. This statistical review suggests midstream management and support staff should anticipate two or three more major peaks during fourth-quarter 2021 through yearend 2022.
Early in the pandemic, governments large and small, regardless of their position on the political spectrum, imposed lockdown restrictions, issued mask mandates, banned large gatherings of adults in close quarters (bars, restaurants, and churches). Employers around the world, from the largest government agencies to small consulting firms, recommended, enabled, and encouraged employees to work remotely. Finally, many governments also imposed strict bans on international commercial airline travel. Lifestyles of all ordinary citizens in most countries were changed radically. Some lifestyle changes were superficial, but others created new sources of stress. Governments also quickly expanded social safety nets to avoid a catastrophic slide into years of global economic depression.
Within 3 months (April-June 2020), demand for refined products (transportation fuels) in all major regional markets worldwide fell 15-90% from 2019 volumes. In the first 6 months of the pandemic, presidents and prime ministers consistently presented the most optimistic perspectives regarding the duration of the disruption. In the history of epidemics, pandemics, and plagues, however, stretching as far back as historical records allow, the human race has rarely defeated viruses within a year or two.
For short-term planning purposes (e.g., the next 18-24 months), should midstream managers and executives maintain an optimistic posture for recovery in refined products demand? Ordinary citizens in small towns and large cities are now resisting further government attempts to micromanage all important aspects of day-to-day life. As resistance becomes more pervasive and intense, governments will become less determined to impose and reimpose lockdown restrictions, and demand for transportation fuels will gradually recover to prepandemic levels. If recovery rates for transportation fuels accelerate in fourth-quarter 2021, OPEC will experience increasing pressure to boost oil production rates to 2019 levels sooner than current events suggest is likely. Slowly and gradually increasing demand for gasoline and diesel fuel is a reasonable premise for short-term planning for midstream companies who market ethylene feedstocks and refinery blendstocks.
Managers and executives in petrochemical companies realize global markets for primary petrochemicals depend on healthy economic growth trends. More importantly, they should realize supply shortages (LPG) and limited naphtha supply will sustain upward pressure on prices for LPG and naphtha feedstocks. So far, US ethylene producers are reaping the benefit of major capital investment in ethane retrofit projects and new ethane crackers. Ethane supply surpluses (as measured by estimates of ethane rejection) are sufficient to meet increasing demand in 2022-23 up to 250,000 b/d.
If COVID-19 continues to infect millions of people, demand for transportation fuels, especially in markets outside North America, will remain below prepandemic levels. Until refiners regain confidence in demand for 3-6 months forward, global crude oil demand will remain below prepandemic volumes and Middle East crude oil producers will continue to restrict crude oil production. LPG production will also remain below prepandemic levels, leaving global LPG supply tight and feedstock buyers in the Asia Pacific and Europe continuing to rely on imports from US and Canadian export terminals. Finally, the shortfall in LPG supply for the Asia Pacific market is beyond North America’s supply capacity. So as Daniel Boone, once said, tighten your belt and keep your powder dry.
The author
Daniel L. Lippe ([email protected]) is president of Petral Consulting Co., which he founded in 1988. He has expertise in economic analysis of a broad spectrum of petroleum products including crude oil and refined products, natural gas, natural gas liquids, other ethylene feedstocks, and primary petrochemicals.
Lippe began his professional career in 1974 with Diamond Shamrock Chemical Co., moved into professional consulting in 1979, and has served petroleum, midstream, and petrochemical industry clients since. He holds a BS (1974) in chemical engineering from Texas A&M University and an MBA (1981) from Houston Baptist University. He is an active member of the Gas Processors Suppliers Association.
