COVID-19 pandemic tests US refiners’ resilience
Dan Lippe
Petral Consulting Co.
Houston
Before onset of the coronavirus (COVID-19) pandemic, 2020 was shaping up to be a promising year for the US economy. On Jan. 2, 2020, the Dow Jones Industrial Index averaged 28,526, up from 15,113 at the beginning of 2016. Results of the University of Michigan’s monthly survey of US consumer confidence showed that most Americans had high expectations that global economic activity would remain on a continued upward trajectory, with the US Consumer Confidence Index consistently averaging 95-100 from 2017 through March 2020. Alongside consumer confidence, corporate optimism also was on the rise, with the official US unemployment rate by the end of first-quarter 2020 falling to a multidecade low of 3.8% from 10% in 2010.
As the New Year began, little did US consumers and corporations fully understand that the die that ultimately would shape 2020 had been cast in November 2019 with discovery of COVID-19 infections in Wuhan, Hubei Province, northern China. While we may never know exactly what happened in Wuhan during the earliest days of the outbreak, the US Centers for Disease Control declared Dec. 1, 2019, the official date of the first COVID-19 case. Based on a typical incubation period of 14 days, the first exposures occurred in early to mid-November 2019.
As we learned with severe acute respiratory syndrome (SARS), which originated in the Asia Pacific in late 2002,and Middle East respiratory syndrome (MERS), which broke out a decade later in Saudi Arabia, a viral infection does not become a pandemic overnight, and an outbreak can be contained if infected people are quarantined. China’s central government failed in responding to the outbreak in Wuhan and restricting travel between Wuhan and the rest of the world so that—based on international air travel statistics—a period of 45-60 days passed during which the virus spread internationally to reach pandemic status via extensive travel into and from China. According to a Sept. 1, 2020, report from the International Air Transport Association (IATA), global air travel started declining sometime in mid to late-January 2020, about 60-75 days after first infections. While China’s air travel started edging lower beginning in late-December 2019 and early-January 2020, US air travel remained at record-high levels until mid to late-February 2020, according to IATA.
The global response to COVID-19 resulted in various governments around the world issuing recommendations and instituting mandates to prevent further spread of the virus, measures which—though lifting—continue to have an adverse effect on demand for transportation fuels.
This article examines the unprecedented impact of the 2020 COVID-19 pandemic on global demand for refined products, as well as how US refiners quickly adapted to drastic changes in transportation fuel demand. The article also provides an outlook for what the industry can expect in 2021-23.
Data uncertainties, sources
In the first few months of the 2020 global economic collapse, consulting firms and analysts within government agencies such as the US Energy Information Administration (EIA), International Energy Agency (IEA), and the Organization for Petroleum Exporting Countries (OPEC) were effectively flying blind.
Reliable domestic data from EIA—the most dependable data source for US petroleum products—routinely has a 2-month lag (January 2020 data was available on April 1, with June data published on Sept. 1). Data from the IEA and Joint Organizations Data Initiative (JODI) have similar lags and are less reliable because participation by many countries is voluntary. OPEC’s Monthly Oil Market Report (MOMR) is the most reliable source of data for global oil production but does not routinely track refinery crude runs, the all-important statistic for crude oil demand. The combination of OPEC’s MOMR report on global oil production and JODI’s monthly statistics for refinery crude runs provide the best insight in variations in global crude oil supply-demand.
Despite the very dense fog of statistical uncertainty in March-April 2020, initial estimates of the virus’ impact on demand for refined products—all based on unreliable statistics, including anecdotal evidence, flight cancellations, and government-imposed bans on international air travel—surfaced in early to mid-March 2020 through various industry outlets. Reliable data for global jet fuel demand released in April 2020 (for January 2020) and May 2020 (for February 2020), however, confirmed that early forecasts calling for global oil demand to decline by 1-3 million b/d were much too hopeful. Subsequent predictions by analysts in May-June 2020, however, turned out to be too pessimistic as forecasters discovered by Aug. 1, 2020, when firm monthly international statistics for April-May 2020 and EIA’s weekly statistical estimates for US refined products supply and implied demand for June-July 2020all became available.
Acknowledging the importance of trends in international demand for refined products and crude oil production, this article focuses on US market trends and domestic refining industry.
US transportation fuel demand
Three transportation fuels—gasoline, diesel, and jet fuel—determine refinery crude oil throughputs, which in turn determine overall crude demand by refineries. Gasoline and diesel are the largest-volume transportation fuels consumed in all regions of the world. While jet fuel also is consumed across global markets, it is a smaller-volume fuel used by fewer than 300 commercial airlines. Since governments around the world hold nearly absolute power over commercial air travel, jet fuel demand is more easily controlled than the individual and business consumers of gasoline and diesel, which remain under the purview of local governments.
In 2019, demand for transportation fuels in US markets was 14.8-16.3 million b/d as compared with 14.9 million b/d in January-February 2020. As early as January 2020, US local and state governments began recommending self-quarantine for everyone who had travelled outside US borders during November-December 2019, and by mid-March 2020, were also recommending wearing protective masks and maintaining social distancing. Mandated closures of restaurants, bars, churches, and schools also began in March 2020, crushing demand for transportation fuels to 12.8 million b/d,3.4 million b/d (21.2%) less than in March 2019. Demand slipped to 10.2 million b/d in April 2020, or 5.8 million b/d (36.6%) weaker than April 2019. US gasoline and distillate fuel oil typically account for 88-90% of the country’s transportation fuel demand, with jet fuel making up the balance. April 2020 marked the low point for US transportation fuels demand.
Stanford University’s Institute for Economic Policy Research (SIEPR) reported as of late-June 2020 that 33% of the US labor force is no longer working, with 42% working remotely (from home or elsewhere), and 26% deemed essential and working on employers’ premises. For the immediate future (2021-23), government health and safety regulations will require large companies to implement social distancing plans as they begin requiring employees to resume working in traditional office environments. If we assume 42% of the US labor force will continue to work from home indefinitely, COVID-19 will limit recovery in transportation fuels demand indefinitely. Some US companies, however, are already beginning to require employees to resume working in conventional corporate office environments in manners consistent with COVID-19 social distancing rules. Most likely, companies in the European and Asia-Pacific regions will also do so.
• Jet fuel. As COVID-19 infections in China started rapidly spreading throughout the world in December 2019-January 2020, governments correctly recognized the associated risks of air travel and began imposing bans on international travel from China. Demand for jet fuel began falling in mid-February 2020 but staged a recovery in late-February and early-March 2020.
In fourth-quarter 2019, jet fuel demand in the US domestic market averaged 1.76 million b/d, peaking at 1.84 million b/d in December 2019. In 8 of the past 9 years, jet fuel demand during the month of January was less than in December, and 2020 was not no exception. Demand in January 2020 was 1.67 million b/d, 165,000 b/d less than in December 2019. As both international and US travel bans took effect, US jet fuel demand fell to a year-to-date low of 0.6 million b/d in May 2020, which was 1.06 million b/d (64%) less than in January-February 2020.
The first ban on US international travel to China took effect Feb. 2, 2020, with a ban on all international travel subsequently declared. Airlines initially responded by cutting fares to stimulate US domestic travel, but as cancellations of conferences and industry annual meetings became widespread after mid-March 2020, and the constant drumbeat of COVID-19’s multiple threats increased, jet fuel demand resumed its decline.
From late-March through July 2020, US jet fuel demand fluctuated within a range of 350,000-800,000 b/d. During this period, jet fuel demand averaged 624,000 b/d and was 966,000 b/d (61%) less than in January 2020. US domestic air travel began recovering in mid to late-July 2020 to average 0.9-1.0 million b/d by early August. Based on IATA data, international air travel fell more sharply, reducing international jet fuel demand by a similar amount. The governments of Europe imposed their own travel bans between European countries and destinations in both China and North America. While the global ban on international air travel was considered an important and critical first step in containing the spread of COVID-19, the pandemic was already well established globally before any country banned inbound air travel from China. European governments furthermore were unable to limit the steady influx of Chinese citizens if they travelled within Europe or into Europe from anywhere other than China.
Based on graphical highlights of IATA monthly statistics on revenue passenger kilometers (RPK)—a transportation industry metric that shows the number of kilometers traveled by paying passengers—US and international jet fuel demand fell sharply during January-April 2020. RPK in April 2020 for US domestic travel was 80% below January 2020, while RPK for international travel in April 2020 fell to nearly zero. US domestic and international air travel began recovering in May-June 2020. IEA statistics showed global demand for jet fuel before COVID-19 bans on air travel was about 8 million b/d. If IATA RPK statistics are representative of jet fuel demand, an 80% decline reduced demand by 6.4 million b/d from peak to trough. The collapse in jet fuel demand, however, is not representative of overall transportation sector demand or crude oil demand.
While the unprecedented collapse in domestic and international air travel was a red flag for transportation sector demand for refined products, jet fuel is the smallest component of transportation-sector refined products demand and is not representative of general trends in on-road demand. US demand for jet fuel is a function of domestic and international travel. Demand also varies regionally within the US. Between 2013-19, jet fuel was the bright shining star for US refineries, demand increasing 24.7%. During the same period, by contrast, gasoline demand increased only 9.9% and distillate fuel oil demand only 8.5%. In 2019, jet fuel yield on refinery crude runs was 10.4-10.8% and peaked at 11.2% in January 2020. As US demand for jet fuel fell 1.24 million b/d (67.6%) during January-May 2020, refinery production fell 1.38 million b/d (73.3%).
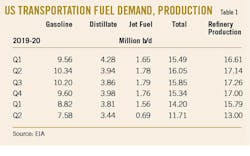
Table 1 shows recent trends in US demand for transportation fuels.
• Gasoline. In early to mid-March 2020, local, state, and federal governments began recommending self-isolation, wearing protective masks, and limiting capacities at churches, restaurants, and bars. Local-government mandated closures of major events (conferences, professional and college sports, rodeos, and concerts) resulted in sharp drops in demand for gasoline and distillate fuel oil (diesel). As drastic as these restrictions were, however, demand for gasoline and diesel declined much less than demand for jet fuel.
While some people resisted subsequent government efforts to limit the spread of COVID-19 that included mandatory closures, others went into strict self-isolation or virtual hibernation. For practical purposes, people voluntarily complied with orders to wear masks and maintain self-quarantine guidelines. More importantly, companies both large and small closed offices and ordered employees to work remotely.
Gasoline demand is a function of total miles driven and efficiency of vehicles in use. EIA’s petroleum products data collection system is a supply-based system, as the EIA does not have a congressional mandate to maintain a demand-side survey system. For practical purposes, however, EIA statistics provide reliable weekly and monthly estimates of gasoline demand based on the simple premise that demand must be equal to net supply.
EIA data showed gasoline demand in 2019 was 9.5-10.3 million b/d to average 9.93 million b/d, with demand in January-February 2020 averaging 9.31 million b/d, up 2.8% from the same period in 2019. In April 2020, demand dropped to 6.0 million b/d, down 35% from January-February and 42% lower than April 2019. When US drivers came out of hibernation in May 2020, gasoline demand improved, jumping to 9.1 million b/d in June-July, still 1.1 million b/d (11%) down from June-July 2019. EIA weekly statistics showed gasoline demand continued to recover in August 2020 but remained consistently 6-7% lower from August through mid-October 2019.
The ban on international air travel and concerns about COVID-19 exposure in airports and planes, however, prompted some US families to take old-fashioned, summer road-trip vacations. The seasonal increase in gasoline demand is reliable and predictable, and more summer road trips helped offset demand impacts resulting from reduced daily commuting. US gasoline demand, however, is not likely to recover to 2018-19 levels until 2022-23.
• Distillate fuel oil. While on-highway demand for diesel fuel is the biggest component of distillate fuel oil demand, EIA’s data collection system does not differentiate distillate fuel oil sales based on the various end-use sectors. EIA does conduct an annual survey of distillate fuel oil sales for 11 end-use categories, the 2018 results of which showed sales to the transportation end-use sector accounting for 83% of total sales, with on-highway sales amounting to 79% of sales to all transportation end-use markets. End-use sectors excluded from the transportation sector include residential and commercial accounts (space heating), oil companies, electric utilities, as well as military and off-highway accounts.
EIA data showed US demand for distillate fuel oil in 2019 ranged from 3.86 million b/d to 4.28 million b/d to average 4.01 million b/d vs. average demand in 2018 of 4.06 million b/d. Consistent with strongly seasonal demand in space-heating markets, distillate demand is also seasonal, with peak demand usually occurring in the first quarter and minimum demand in the third quarter. In fourth-quarter 2019, distillate demand was 3.98 million b/d, down 166,000 b/d (4%) from fourth-quarter 2018. Based on mild winter weather in the US Northeast, the year-over-year decline in fourth-quarter 2019 extended into first-quarter 2020, with distillate demand of 3.94 million b/d in January-February.
In contrast to the sharp decline in demand for jet fuel and gasoline, and consistent with the concentration of demand in the on-highway sector, US distillate demand in March 2020 was 3.56 million b/d, down 698,000 b/d (16.4%) from a year earlier. It edged lower to 3.44 million b/d in May and 3.42 million b/d in June. Second-quarter 2020 distillate demand averaged 3.44 million b/d, down 495,000 b/d (12.6%) from second-quarter 2019. With US workers generally complying with recommendations to self-isolate and many substituting on-line shopping for in-person shopping in grocery stores and shopping malls, some demand support inevitably resulted from a spike in home delivery services.
As US domestic economic activity began a gradual recovery in third-quarter 2020, distillate demand also increased. Based on EIA July 2020 monthly statistics and weekly statistics for August-September 2020, distillate demand in the third quarter was 3.60-3.65 million b/d, 237,000 b/d (6.1%) less than third-quarter 2019.
US refining operations
Beginning in 1940 and continuing for 50-60 years, US refining companies substantially increased operational flexibility.
According to an annual EIA survey, the US refining industry operated 19 million b/d of crude distillation capacity at 135 locations on Jan. 1, 2020. Alongside atmospheric crude distillation units, a typical full-conversion refinery operates four other major processing units: fluid catalytic cracking units (FCCU), catalytic reformers, catalytic hydrocrackers, and thermal cokers. At the beginning of 2020, US refiners operated the following additional capacities: FCCU, 6 million b/d; catalytic reforming, 3.8 million b/d; catalytic hydrocracking, 2.5 million b/d; and thermal coking, 3.1 million b/d.
While reformers increase the octane value of virgin naphtha and cokers convert crude oil fractions with the highest boiling ranges to more valuable components, FCCUs and catalytic hydrocrackers are the units that provide refineries with the necessary flexibility to adjust the product mix without requiring major changes in crude throughput rates. Of the latter two units, catalytic FCCUs are the most critical, and in second-quarter 2020 US refiners relied on the size and flexibility of FCCUs to balance operations and adjust product slates to the unexpected changes that occurred.
US refineries are designed to remain in balance within a reasonable range of crude throughputs. Motor gasoline for the general driving public is the industry’s primary product, while distillate fuel oil (on-highway diesel fuel) is the second most important product by volume. Jet fuel is important but is a distant third in volume. In 2017-19, the product slate for US refineries varied seasonally but remained nearly constant year-over-year. On a seasonal basis, gasoline yields accounted for 57-61% of crude runs, distillate fuel oil yields 29-31%, and jet fuel yields 9.9-10.8%. On an annual basis, gasoline yields were 58-60%, distillate fuel oil yields 29-30%, and jet fuel yields 10.0-10.6%.
Following the confirmed outbreak of COVID-19 and its gradual elevation to pandemic status in early 2020, US refineries had about 60 days to prepare for the full brunt of the health crisis’s looming impact on demand. Refining companies began adjusting crude runs and product slates in ways that were almost unimaginable before second-quarter 2020. Though details varied from region to region, the trend in refinery crude runs in first-half 2020 reflects the overall impact of voluntary and mandatory closures on refined products demand across the US.
As demand for transportation fuels declined, refiners began cutting crude runs. In the first 60 days, crude runs fell 3.26 million b/d (20.3%) from the January-February 2020 average, with run cuts varying regionally by PADD region (see accompanying box for definition of PADD regions). Crude runs in PADDs 1, 2, 4, and 5 fell to their year-to-date lows in April 2020 before beginning to recover in May. Crude runs in PADD 3, however, increased in March 2020 before reversing course to reach a year-to-date low in May. By July 2020, crude runs in all US regional markets had increased but remained below their January-February 2020 averages. The regional variation in the strength of recovery is stark. Crude runs in July 2020 vs. January-February 2020 averages were as follows:
- PADD 4, 98.2%.
- PADD 2, 95.3%.
- PADD 3, 90.4%.
- PADD 5, 79.1%.
- PADD 1, 71.8%.
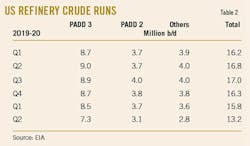
Table 2 shows US refinery crude runs from 2019 through second-quarter 2020.
US fuel production, yields
In January-February 2020, US refinery yields for gasoline, distillate fuel oil, and jet fuel were all within the range of historic averages. As local governments increasingly began encouraging stay-at-home measures to prevent ongoing spread of the virus, domestic refiners took the first step in adjusting to COVID-19’s pending impacts on demand for transportation fuels by reducing operating rates (e.g., crude runs). In January-February 2020, US crude runs averaged 16.1 million b/d before falling to 12.9 million b/d in March-April. In May 2020, as demand began to slowly recover, refiners increased runs up to 14.3 million b/d by July.
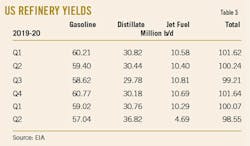
Table 3 shows US refinery product yields.
In March 2020, when distillate yields reached record-high levels, refiners held FCCU feed rates steady at 26.7% of crude runs before slashing those rates to 20.8% in April. The accelerating collapse in jet fuel demand in April-May 2020 prompted refiners to divert 60% of the jet fuel fraction into the distillate fuel oil pool so that distillate fuel oil inventory surged almost 50 million bbl to record-high levels of 175.9 million bbl on June 1 and 177.6 million bbl on July 1. During April-July 2020, US gasoline inventory (finished gasoline and all blending components) declined by 11.6 million bbl.
In contrast to notable season-over-season and year-over-year inventory variations for distillate fuel oil and gasoline, all regional jet fuel distribution systems operate on the principle of limited inventory variation. In March-July 2020, US jet fuel inventory was 40.0-41.5 million bbl. Inventory remained relatively consistent with industry management practices and cooperation between airport management and refining companies.
US crude supplies
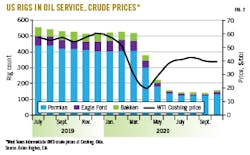
Refinery crude runs determine crude oil demand in US domestic markets. Four states (New Mexico, Texas, Oklahoma, North Dakota) accounted for 65-70% of US crude production (Lower 48 only) in 2019-July 2020. Refinery crude runs in PADDs 2 and 3 in 2019, however, exceeded production in these four states by 4.5-5.0 million b/d (Figs. 1-2). If all offshore production from the US Gulf of Mexico (1.8-1.9 million b/d) was delivered to refineries in Louisiana or along the Texas Gulf Coast, the supply shortfall most likely was 2.5-3.5 million b/d.
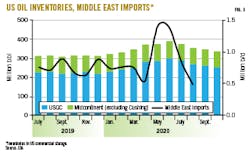
Based on detailed statistics on sources of US crude oil imports, imports from Canada and Mexico accounted for 65-68% of all imports in second-half 2019 and 70-75% in January-April 2020. Imports from OPEC countries in the Middle East were 758,000 b/d in second-half 2019 and 704,000 b/d in January-April 2020, during which time OPEC producers—primarily Saudi Arabia, Kuwait, and the United Arab Emirates—maintained high production rates. These countries exported some of their surpluses to US refiners, with US imports from Middle East countries spiking to 1.39 million b/d in May-June 2020 before dropping to 849,000 b/d in July. The spike in imports from Middle East suppliers totaled 63 million bbl in May-July 2020. On Apr. 1, 2020 inventory in PADDs 3 and 2 (excluding Cushing, Okla.) was 350 million bbl, and on July 1, 90 million bbl higher. The cumulative increase in May-June 2020 was 41 million bbl (65%) of the increase in Middle East imports.
Fig. 3 shows trends in US crude oil inventory (commercial storage in PADDs 2 and 3) and an overlay of US crude imports from Middle East producers.
US oil producers and midstream companies operate an extensive pipeline grid that connects Alberta, Canada, with refineries and storage installations in PADDs 2 and 3, enabling Canada to be largest source of US crude oil imports. Based on geographic proximity to Louisiana and Texas—the largest concentration of US refining capacity—Mexico’s exports to US refiners remained flat at 650,000-775,000 b/d during second-half 2019 and first-half 2020. Canada and Mexico will continue to be the most important sources of US imports, with imports from OPEC producers in the Middle East most likely falling to record lows in second-half 2020 and first-half 2021.
Global crude production, refinery runs
OPEC’s MOMR reports crude oil production for OPEC member countries based on secondary sources and direct contact (effectively self-reporting). Secondary sources use ship-tracking software to estimate production. Based on secondary sources, Middle East countries produced 21.5 million b/d in first-quarter 2020 and 19.3 million b/d in third-quarter 2020. OPEC members in Africa produced 5.1 million b/d in first-quarter 2020 and 4.1 million b/d in the third quarter. Production from OPEC member countries in the Middle East and Africa in third-quarter 2020 was 3.1 million b/d less than in the first quarter. The overall reduction in global crude oil supply based on reduced production in the Middle East (2.5-3.0 million b/d), Russia (1.5-2.0 million b/d), and US (2.7 million b/d) in second and third-quarters 2020 was 6.7-7.7 million b/d. Based on pre-pandemic global crude oil production of 80-83 million b/d, supply curtailments by major producers accounted for 8.4-9.3% of global demand.
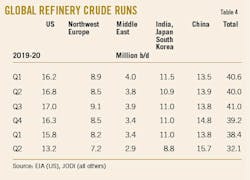
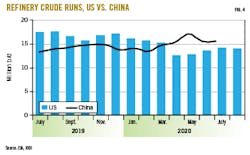
One surprise of the global recession and its impact on the global refining industry was the divergent trend in refinery crude runs for the US vs. China. US refineries reduced crude runs 2.4 million b/d (15.8%) in March-April 2020. According to JODI statistics, refinery crude runs in China were 13.8 million b/d in third-quarter 2019, 14.8 million b/d in fourth-quarter 2019, 13.8 million b/d in first-quarter 2020 and 15.7 million b/d in second-quarter 2020 before jumping to a record high 17.1 million b/d in July 2020. In contrast, refinery crude runs in Australia, India, Japan, and South Korea were 11.5 million b/d in first-quarter 2020 and 9.2 million b/d in the second quarter (Table 4). The quarterly decline of 2.3 million b/d (20.3%) in these regions was consistent with percentage declines in the US and Western Europe during the same period.
Fig. 4 shows a comparison of US and Chinese refinery crude runs.
Near-term outlook
The paramount objective for every article in the midstream, petrochemicals, special topic iterations of this series is always to reduce the fog of uncertainty that influences decisions to capitalize on some opportunities and defer decisions on others. No matter how historians debate the circumstances of 2020, we learned some important lessons. Refinery operations managers, relying on their software tools (e.g., linear optimization models for overall refinery operations and non-linear optimization models for gasoline blending) adjusted product mixes to minimize the impact of the collapse in jet fuel demand.
Based on EIA final data for July and weekly estimates for August-September, US domestic demand for gasoline and distillate fuel oil in third-quarter 2020 will average 12.5-12.7 million b/d. Demand in third-quarter 2020 equaled that of the first-quarter, though both were 1.3-1.4 million b/d (9.7%) less than the same periods in 2019. With many US employees who worked from home in second and third-quarters 2020 returning to work in traditional spaces in the fourth quarter, gasoline demand likely will continue to recover through the end of fourth-quarter 2020 (8% lower than 2019) and first-quarter 2021 (2-4% less than 2020).
As jet fuel demand declined, refinery managers reduced production by shifting the jet fuel fraction into the distillate fuel oil pool. Jet fuel yields were 9-11% in first-quarter 2020 before falling to 3.9% in May to average 4.7%. Distillate fuel oil yields were 30.8% in first-quarter 2020 and jumped to 36.8% in second quarter. At constant yields, distillate fuel oil production would have been 4.05 million b/d, down 787,000 b/d from actual production. The lower jet fuel production and increase in distillate fuel production offset one another, and jet fuel demand will lag recovery in demand for gasoline and distillate fuel oil.
Two questions will influence short-term marketing plans and longer-term strategic and capital budget plans for the next 5-10 years.
First, how long will Russia and Saudi Arabia remain committed to rebuilding their respective shares of the global market for crude oil exports? For almost 50 years, the key members of OPEC had a common objective: limit crude oil production and defend a hard floor for benchmark crude prices, as higher prices are always better. In 2014, in the face of accelerating growth in US crude oil production, Saudi Arabia declined to lead OPEC to curtail crude oil production and sustain benchmark prices at $90-100/bbl. The objective, stated or unstated, was to halt growth in US crude oil production.
Second, how often will Saudi Arabia open the taps and collapse crude oil prices to achieve the dual objectives of maintaining high levels of compliance with OPEC production quota agreements by other OPEC members and limiting growth in oil production from major US shale plays?
Those who manage day-to-day production, distribution, and marketing functions may be excused for concluding that Saudi Arabia’s leadership had reverted to the tried-and-true objectives and tactics of the previous 45 years. Others with longer-term responsibilities, however, have no such excuses, despite the fact that very few of us could have anticipated a pandemic that could push the global economy into its worst—and nearly instantaneous—collapse in any of our memories.
For the next 5-10 years, many will now constantly consider the prospect that OPEC’s new objectives are to make crude oil supply plentiful, manage the global supply-demand balance to create a hard cap on prices, and limit the likelihood that prices will increase to levels that erode market share for the world’s major exporting countries. In the long term, US refiners will benefit from plentiful domestic supply as well as a modest but competitive cost-of-crude advantage vs. refiners in Europe, South America, and the Asia Pacific.
The author
Daniel L. Lippe ([email protected]) is president of Petral Consulting Co., which he founded in 1988. He has expertise in economic analysis of a broad spectrum of petroleum products including crude oil and refined products, natural gas, natural gas liquids, other ethylene feedstocks, and primary petrochemicals.
Lippe began his professional career in 1974 with Diamond Shamrock Chemical Co., moved into professional consulting in 1979, and has served petroleum, midstream, and petrochemical industry clients since. He holds a BS (1974) in chemical engineering from Texas A&M University and an MBA (1981) from Houston Baptist University. He is an active member of the Gas Processors Suppliers Association.
