Appalachia midstream develops integrated NGL infrastructure
Dan Lippe
Petral Consulting Co.
Houston
Appalachia, birthplace of US oil and gas production, has witnessed fully integrated midstream infrastructure emerge in just 10 years. While future development, aided in part by continued gas-directed drilling amid rising petrochemical demand, likely will occur more slowly, ongoing NGL-supply growth in the region will require further midstream expansion.
From a blank slate
After oil and gas wells drilled in central Pennsylvania in the 1850’s and 1860’s came and went, the producing states in the Middle Atlantic region reverted to pristine farmland. Imagine the quiet lifestyle of the western Pennsylvania countryside in 2010. By second-half 2011, however, Baker Hughes rig count data showed Marcellus-Utica had 140-150 operating rigs (16.3% of all active rigs in US gas-drilling service).
Drilling is the first wave of activity in the hydrocarbon value chain. Oil and gas production transforms rural, suburban, and even urban areas, such as Barnett Shale in the northern suburbs of Fort Worth, Tex. As producers move into an area to develop new sources of supply, they begin negotiations with midstream companies even before they spud the first well. Producers and midstream companies must acquire permits from local and state authorities before work begins. Local and state agencies in the key states (Ohio, Pennsylvania, and West Virginia) did not have extensive experience in evaluating permit requests.
Despite these challenges, gas-gathering pipelines were laid, gas processing plants were built, and raw-mix gathering systems and fractionators were engineered, designed, and constructed. Producers worked hand in hand with midstream companies and achieved remarkable results. In 2010, when gas producers began to scramble to acquire major lease acreage positions in Utica and Marcellus shales, NGL production for the entire Middle Atlantic region was 15,000-20,000 b/d. Production in Ohio was 12,000 to 14,000 b/d, with zero ethane production in both regions. A single gas plant (250 MMcfd) in the prolific Permian basin, by contrast, is likely to produce 25,000-30,000 b/d, including ethane.
In the very early years, industry viewed Marcellus as one large, continuous dry gas shale play. From this perspective we can understand why the midstream industry’s largest vertically integrated companies—already established in expanding oil, gas, and NGL infrastructure for the surge in crude oil and rich-gas production in West Texas—had limited interest in jumping into this region.
As drilling activity extended into western Marcellus (western West Virginia and southwest Pennsylvania) and eastern Utica (Ohio), producers discovered a source of NGL-rich gas. Local midstream companies commenced developing the full range of midstream infrastructure with a blank slate. For the first few years, the key midstream players advanced infrastructure projects with universal optimism regarding pricing and profitability. Local NGL production was a lock to move to consumers in local markets who had depended on shipments from the US Gulf Coast (USGC) by pipeline and rail during winter months when demand reached its peak (November-February). As NGL supply exceeded expectations, however, optimism regarding NGL pricing and profitability waned.
In the early days of Marcellus-Utica development, established East Coast midstream companies such as MarkWest Energy Partners LP (now a subsidiary of MPLX LP) and Sunoco Logistics Partners LP patterned development after the USGC. US East Coast midstream companies expected to build out a full slate of infrastructure projects. The list of projects, in addition to various gas processing plants, included full five-product fractionators, underground salt cavern storage, and an export terminal in the Port of Philadelphia at Marcus Hook, ready-made for loading very large gas carriers (VLGCs) with seasonally surplus propane and butane.
Gas production, plant throughput
Historically, NGL supply analysis began and ended with detailed analyses and forecasts for natural gas demand and production. NGL supply in the core production regions is now, primarily, a function of crude oil production, associated gas production, and NGL content of natural gas supply delivered to gas processing plants. Crude oil production is the primary driver for NGL supply growth in the core NGL supply regions (Colorado, North Dakota, New Mexico, Oklahoma, Texas, and Wyoming), but natural gas remains the primary driver for NGL supply in Appalachian basin. Before discovery of the rich-gas production zones in western Marcellus and eastern Utica, rapid growth in natural gas production yielded limited growth in NGL supply.
According to US Energy Information Administration (EIA) statistics, total gas production in 2011 in Marcellus (technically, all East Coast states) was 4.756 bcfd in 2011 and increased to 21.900 bcfd in 2018. Total gas production in the Utica basin in eastern Ohio was 214 MMcfd in 2011 and increased to 6.532 bcfd in 2018. NGL-rich gas production in 2010 was less than 50 MMcfd in Marcellus and less than 15 MMcfd in Ohio. By 2018, Petral Consulting Co. estimates show NGL-rich gas was 4.934 bcfd in Marcellus and 1.550 bcfd in Ohio. NGL-rich gas in 2018 in Marcellus was 22.5% of total gas production. NGL-rich gas production in Utica was 23.7% of total marketed gas supply.
The surge in NGL-rich gas supply in Marcellus began in 2011 when NGL-rich gas production jumped to 800 MMcfd. Gas-to-oil ratios (GOR) before 2011 were less than 1 Mcf/bbl. After 2011, GOR were 50-85 Mcf/bbl. In the midstream industry core-production region (Colorado, New Mexico, North Dakota, Oklahoma, Texas), GOR are in the range of 1-4 Mcf/bbl. During the early years (2007-12) of rapid growth in NGL-rich gas, East Coast crude oil production was 15,000-25,000 b/d.
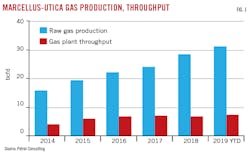
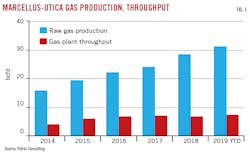
Fig. 1 shows trends in raw gas production and gas plant throughput rates. Table 1 summarizes marketed gas production.
Gas plant throughput rates for Marcellus plants tracked growth in NGL-rich gas production. According to EIA statistics, gas-plant throughput in Marcellus was 531 MMcfd in 2010 and increased to 3.201 bcfd in 2014. Petral Consulting estimates plant throughput reached 4.600 bcfd in 2018. Plant throughput was 95% of NGL-rich gas production in 2014 and 93% in 2018.
Gas plant throughput for Utica plants (eastern Ohio) was 6 MMcfd in 2010 and increased to 943 MMcfd in 2014 before reaching 2.118 bcfd in 2018. Plant throughput was 149% of NGL-rich gas production in 2014 and 137% in 2018. Gas plants in Ohio—in contrast to those in Marcellus—process both NGL-rich gas and some lean gas. Based on Petral Consulting estimates, lean-gas throughput was 39% of total throughput in 2014 but was only 27% in 2018.
Table 2 shows gas plant throughput for both Marcellus and Utica.
Marcellus-Utica NGL supply
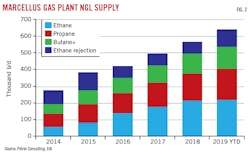
NGL supply increased in parallel with growth in NGL-rich gas production. NGL recovery factors for Marcellus gas plants were 1.8-1.9 gal/Mscf in 2010, 2.5 gal/Mscf in 2014, and increased to 4.5 gal/Mscf in 2018. Ethane production was 40% of estimated full recovery capability in 2014 and increased to 76% in 2018. The increase in ethane production made a major contribution to the jump in NGL-recovery factors during 2014-18. Recovery factors for all other components (propane+), however, also increased during this period. The recovery factor for propane+ was 1.8 gal/Mscf in 2014 and 2.6 gal/Mscf in 2018. NGL production (all Marcellus gas plants and all components) averaged 24,200 b/d in 2010, increased to 194,200 b/d in 2014, and was 497,000 b/d in 2018.
NGL recovery factors in Utica were 2.8 gal/Mscf in 2014 and remained at 2.8 gal/Mscf in 2018. Gas plants in Ohio didn’t begin to recover ethane in any notable quantity until 2015, but ethane recovery in Ohio was just 18,000-25,000 b/d (14-21% of full-ethane recovery) during 2014-18. With ethane recovery never more than 22% of potential ethane supply, trends in propane+ recovery factors are more indicative of changes in total NGL content for natural gas delivered to gas plants in Ohio and varied between 1.8-2.2 gal/Mscf. Petral Consulting estimates NGL-recovery factors for Ohio gas plants, assuming 90% ethane recovery, will increase to 3.3-3.6 gal/Mscf by 2025. NGL production from Ohio gas plants was 63,000 b/d in 2014 and 119,000 b/d in 2018. NGL production in 2018 with full-ethane recovery would have been 225,000 b/d.
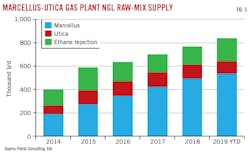
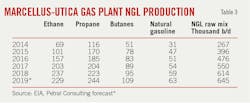
Figs. 2-3 show trends in NGL production (by major component plus estimated ethane rejection) and regional breakouts for Marcellus and Utica. Table 3 shows production volumes for NGL raw mix in Marcellus and Utica.
Ethane local demand, exports
When most midstreamers hear the word exports, their first thought is the 1-million b/d waterborne LPG export terminals of the Texas Gulf Coast. Gas producers and gas processors in the Appalachian region, however, also have a dedicated ethane pipeline (Energy Transfer Partners LP’s Mariner West) that connects fractionators in Pennsylvania to salt cavern storage in Sarnia, Ont. Energy Transfer’s Mariner East moves ethane (as well as propane and butane) to a waterborne export terminal at Marcus Hook.
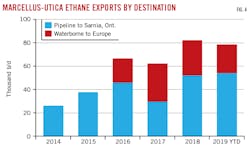
Ethane exports to ethylene plants in Sarnia began in 2014 and reached 20,000-30,000 b/d in the first year. Exports via Mariner West increased to 35,000-45,000 b/d in 2015 and 40,000-50,000 b/d in 2016. Ethane exports to Nova Chemical Corp.’s Sarnia plant enabled gas producers to monetize ethane as an NGL product. Before signing long-term ethane supply contracts with gas producers, naphtha was the principal feedstock for Nova Chemical’s plant at Sarnia. Pipeline ethane exports to Sarnia also helped ExxonMobil Chemical Co. lock in Appalachian ethane supplies for its Sarnia plant. If all ethylene capacity in Sarnia is converted to run with purity ethane feed, demand will be 65,000-70,000 b/d.
Although Mariner West pipeline was completed and in service by early 2014, midstream companies did not overlook the opportunity to capitalize on development of waterborne ethane export opportunities from Marcus Hook. In fact, the key midstream companies in Appalachia were able to build the first phase of Mariner East, cryogenic ethane storage, and necessary refrigeration and ship-loading facilities for waterborne ethane exports. Ethane exports from Marcus Hook began 6 months sooner than the first ethane export terminal in the Houston Ship Channel. Ethylene plants in Scotland and Norway are the primary destinations for waterborne ethane exports from Marcus Hook. Waterborne ethane exports were 20,000-30,000 b/d in second-half 2016 before rising to 25,000-45,000 b/d in 2017.
Until 2021 or 2022, feedstock demand for ethane from Appalachian NGL fractionators will be limited to exports to ethylene producers in Canada and Northwest Europe. Royal Dutch Shell PLC, however, commenced construction of its ethane cracker in late 2017. Based on likely completion by late 2020 or early 2021, Shell’s new plant will consume ethane at rates of 85,000-90,000 b/d.
Exports to all destinations were 75,000-125,000 b/d in second-half 2018 but gas plant production was 225,000 b/d. Surpluses from Marcellus-Utica gas plants in second-half 2018 were 100,000-150,000 b/d. In 2012-13, Enterprise Products Partners LP converted one pipeline in the TEPPCO pipeline system to ethane service and began deliveries to Mont Belvieu, Tex., in 2014. The southbound pipeline is now called Appalachia-to-Texas Express (ATEX).
Various gas producers and midstream companies entered into long-term, take-or-pay agreements. Even though the full delivered cost for ethane transfers to Mont Belvieu was 50-65¢/gal for take-or-pay shippers, interregional ethane transfers were 25,000-45,000 b/d in 2014 and increased to 65,000-100,000 b/d in second-half 2016 before rising to 100,000-150,000 b/d in 2018. Until the first round of take-or-pay contracts expire, surplus ethane will continue to move via ATEX to Mont Belvieu.
Fig. 4 shows trends in Marcellus-Utica ethane exports.
Propane local demand, exports
Before 2010, local propane supply satisfied only 10-15% of retail propane demand in the northeast region. Retail propane marketers in the northeast US depended on imports (Canada and Northwest Europe) and interregional transfers from the USGC. As gas plant production increased rapidly during 2014-18, however, local gas plants and fractionators became the primary sources of propane supply for retail markets in the Northeast US.
Propane supply from local gas plants and fractionators was 284,000 b/d in 2018. Propane supply from local refineries was 25,000-30,000 b/d, while total production from local sources was 314,000 b/d. Imports into the regional market from Canada and Europe were 40,000-75,000 b/d in winter 2018. Canadian imports into US markets are reported based on which US Customs District is the point of entry. As railcars account for all Canadian imports into the Northeast US, some Canadian imports are just passing through on their way to retail markets in northern and central Kentucky, northwest Tennessee, and even western North Carolina.
The primary market for propane is in the residential and commercial end-use sectors of retail propane markets in the Northeast US. Space heating demand accounts for 80% or more of total retail propane demand. Propane supply from gas plants and fractionators in Marcellus-Utica is sufficient to meet 100% of regional demand in an average or warmer-than-average winter. Petral Consulting estimates retail propane demand is 200,000-350,000 b/d during October-March and is 70,000-100,000 b/d in the offseason. Comparing local production and Canadian imports vs. retail demand, we observe local supply is surplus to demand even during the peak-demand months during a typical winter heating season. In the offseason before 2018, surpluses exceeded 100,000 b/d, and all surpluses moved to storage in other regions or found their way into the Texas Gulf Coast to become a small component of USGC supply.
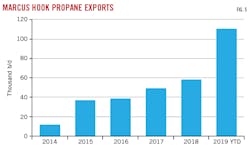
When space heating demand is at its seasonal minimum (March through September or October), gas producers and midstream companies must cope with surplus propane supply. Before Sunoco Logistics completed Mariner East 2 in late 2018, propane exports from Marcus Hook averaged 35,000-55,000 b/d in the offseason (second and third quarters) during 2014-17. Mariner East 2 provided a major boost in capacity from western Pennsylvania to the Port of Philadelphia, and exports increased to 153,000 b/d in second-quarter 2019. In the previous 3 years, exports from Marcus Hook during second-quarters 2015-17 were 45,000-55,000 b/d.
Fig. 5 shows trends in propane exports from Marcus Hook.
Butanes, natural gasoline supply, pricing
The market for butanes and natural gasoline is exclusively the purview of local refineries. According to EIA’s annual report of refining capacity for Jan. 1, 2010, refining companies operated 13 units with a combined capacity of 1.4 million b/d. These refineries were in five states, but five were in Pennsylvania and five in New Jersey. According to the same report of US refining capacity for Jan. 1, 2019, the industry now operates only eight refineries in four regional states. These have a combined crude distillation capacity of 1.22 million b/d. Two are in New Jersey, while four are in Pennsylvania. Delaware has one unit, and West Virginia is home to a very small refinery with a crude distillation capacity of 22,000 b/d. On this basis, local demand for butanes and natural gasoline is concentrated in Pennsylvania and New Jersey.
Before gas producers had developed enough rich-gas production in Utica and Marcellus, local supplies of normal butane provided only 45-55% of RVP-blending demand for East Coast refineries. In winter 2011, East Coast refineries used 12,500 b/d of gas-plant normal butane, but local normal butane production was 5,400 b/d. In winter 2012, refineries used 14,900 b/d of gas-plant normal butane, with local supply increasing to 8,100 b/d. In the 2011-12 winter RVP-blending seasons, the shortfall of local production required interregional transfers into Pennsylvania and New Jersey by pipeline and rail.
Refineries in Philadelphia have relied upon normal butane supply shipped from Mont Belvieu via the TEPPCO pipeline system. The cost of incremental supply via TEPPCO was equal to non-TET normal butane prices in Mont Belvieu plus the pipeline tariff of 15¢/gal. (“TET” is short for “Texas Eastern” and refers to petroleum products in Texas Eastern storage at Mont Belvieu now owned and operated by Lone Star Partners, an operating unit of Energy Transfer. “Non-TET” refers to product at Mont Belvieu but in other owners’ facilities.)
Refineries in New Jersey, having no pipeline connections, relied on normal butane shipments via rail or truck. Depending on where these supplies originated, delivered cost of incremental normal butane supply was 15-25¢/gal more than prices in Mont Belvieu. Refineries rely on very sophisticated, nonlinear economic optimization models to manage gasoline blending. These software systems determine the economic maximum volume of each component in each blend batch of motor gasoline. As was true in other regional markets in 2011-18, refinery demand for gas-plant normal butane in the East Coast market increased as the cost of supply delivered to the refinery gate declined.
Local production increased to 18,600 b/d in winter 2013 and 31,000 b/d in winter 2014. In these two winters, East Coast refineries consumed 100% of local supply. Refinery demand for RVP blending increased to 35,000 b/d in winter 2017 and 46,300 b/d in winter 2018, but local production increased to 45,000 b/d and 54,000 b/d in 2017 and 2018, respectively. Gas-plant normal butane supply has been surplus to local demand since winter 2016. The surplus indicates normal butane demand for winter RVP blending is now limited by motor gasoline’s maximum RVP. East Coast refineries finally discovered that the cost of recycling refinery butane (a mixture of normal butane, isobutane, butylenes, and even propylene and pentanes) from storage was more expensive than buying gas-plant normal butane and industry demand for gas plant supply increased to 46,300 b/d in winter 2018. Local production, however, was still surplus to demand by 7,900 b/d.
Refineries use isobutane to produce a high-octane, low-RVP blendstock commonly referred to as alkylate. Reformers and other process units produce isobutane as a process byproduct. Most refineries maximize the use of internally generated supply and purchase isobutane from midstream companies as supplemental feed. In 2011-13, refinery demand was 8,000-12,000 b/d, while isobutane production from local gas plants was 4,000-7,500 b/d. Refineries purchased 6,000-8,000 b/d of isobutane from sources in other regions. Imports from Sarnia were 3,000-4,500 b/d in 2011-13, and the balance was acquired from Conway, Kan., and Mont Belvieu.
Local supply increased to 24,400 b/d in 2018, up 20,000 b/d from 2011. Imports from Canada remained steady within a range of 2,000-3,000 b/d. Demand increased to 13,000-14,000 b/d in 2017-18. Gas producers and midstream companies had a steadily increasing surplus during 2013-18. The supply surplus reached 9,500 b/d in 2017 and 14,400 b/d in 2018.
Since EIA reports all gas-plant NGL production volumes on a purity component basis, the true surplus of purity isobutane is likely to be notably less since some fractionators in Marcellus-Utica do not fractionate field-grade butanes into purity components. For RVP-blending purposes, purity normal butane and field-grade butane achieve the desired motor gasoline blend.
When the swing from shortages to surpluses of local supply for both isobutane and normal butane are consolidated, midstream companies had gas-plant butane surpluses of 35,000-55,000 b/d in both second and third-quarters 2018. Butane supply surpluses were 5,000-25,000 b/d in winter 2018.
Finally, natural gasoline supply from local gas plants and fractionators increased to 46,000 b/d in 2018 from 6,000 b/d in 2011. According to EIA statistics, no East Coast refineries used any natural gasoline for a period of 18 years (1997-2014). As natural gasoline production increased, 100% of additional supply was surplus to regional demand and had to be transferred to other regional markets by truck or rail. Some production from Marcellus-Utica probably could have displaced Midcontinent supply sources for refinery demand for natural gasoline in Ohio, Indiana, and Illinois, but demand in this region fell to 8,000-10,000 b/d in 2015-17 from 18,000-22,000 b/d in 2010-13.
As freight rates for transfers to Midcontinent and USGC storage increased and netback values in Marcellus-Utica fell to discounts of 20-25¢/gal vs. Mont Belvieu and Conway, the economics for natural gasoline as motor gasoline blendstock improved. EIA data show refiners first used natural gasoline as a gasoline blendstock in fourth-quarter 2015 and first-quarter 2016. With strict summer-season RVP limits, East Coast refinery demand was nearly zero in May-September 2016. As RVP limits increased, refinery demand increased to 7,000-8,000 b/d in winter 2016 and varied within a range of 3,000-8,000 b/d in winter 2017. Demand reached 9,200 b/d in March 2019.
With 46,000 b/d of local natural gasoline production, midstream companies also must arrange to ship 35,000-40,000 b/d of surplus natural gasoline to storage facilities in the Midcontinent and USGC. The combined surpluses of butanes and natural gasoline in spring and summer are typically 70,000-90,000 b/d. Since refinery demand in the Midcontinent and USGC has not increased, surpluses from East Coast gas plants and fractionators find their way into the Alberta diluent market directly or by displacement if railcar transfers are delivered into storage in Conway or Mont Belvieu. Surpluses of this magnitude with local pricing based on discounts of 20-25¢/gal vs. spot prices in Conway and Mont Belvieu should eventually attract interest as petrochemical feedstocks.
Regional outlook
Just before the surge in natural gas production from Marcellus-Utica began, the cottage industry of unconventional gas and oil conferences didn’t exist. Producers and midstream companies didn’t join with bankers and private-equity fund managers to discuss the prospects for getting rich. Farmers, producers, and midstream companies who got in early got rich. Natural gas production from Marcellus-Utica, however, soon exceeded even the most optimistic forecasts for demand growth in local markets within the region.
Until the production surge reached surplus levels, wellhead prices for natural gas in Appalachia maintained premiums of 30-50¢/MMbtu vs. spot prices at Henry Hub, La. Premiums began to weaken in 2010 and slipped into persistent discounts of $0.50-1.00/MMbtu in 2014-18. As new natural gas pipelines were constructed to move natural gas from Marcellus-Utica into domestic markets in the southeastern US, discounts stabilized at 30-50¢/MMbtu, but wellhead prices throughout North America in 2018 were down $1.00-1.25/MMbtu from 2014.
Further midstream industry development opportunities for the next 10 years will depend on the intensity of gas-directed drilling activity. In 2011, 130-150 rigs were in active service in Marcellus-Utica, according to Baker Hughes. As natural gas prices declined, the rig count fell to 35-40 in mid-2016 but recovered to 70-75 in second-half 2017, stabilizing at this level through June 2019.
EIA statistics show NGL production for the East Coast region increased at 70,000-85,000 b/d/year in 2015-18. Propane+ production growth was 35,000 b/d/year in 2017-19. Growth in propane+ production in 2019 vs. 2018 is based on 6 months actual production data and 6 months Petral Consulting forecasts. Steady growth in propane+ production since 2017 is a strong leading indicator that gas producers will maintain active drilling programs in the rich-gas zones in western Marcellus and Utica.
Midstream companies may not have to work at the breakneck pace of the past 10 years to continue expanding infrastructure, but continued NGL-supply growth will require continued development of the industry’s most profitable segments in Appalachia. The midstream industry has always worked hand in glove with petrochemical companies. The long-term outlook for NGL market development in Appalachia is likely to follow a similar path.
The author
Daniel L. Lippe ([email protected]) is president of Petral Consulting Co., which he founded in 1988. He has expertise in economic analysis of a broad spectrum of petroleum products including crude oil and refined products, natural gas, natural gas liquids, other ethylene feedstocks, and primary petrochemicals.
Lippe began his professional career in 1974 with Diamond Shamrock Chemical Co., moved into professional consulting in 1979, and has served petroleum, midstream, and petrochemical industry clients since. He holds a BS (1974) in chemical engineering from Texas A&M University and an MBA (1981) from Houston Baptist University. He is an active member of the Gas Processors Suppliers Association.
