US olefins industry poised for further global growth
Dan Lippe
Petral Consulting Co.
Houston
For chemical companies involved in basic olefins and polyolefins markets, first-half 2019 was no dream. But the reality was not as stormy as many had expected (OGJ, Mar. 4, 2019, p. 36).
During the fury of a Kansas tornado, Dorothy of Wizard of Oz fame had a few moments of anxiety regarding her immediate future. Who could blame her? While Dorothy’s experience with the Kansas tornado and subsequent trip to the Emerald City via the Yellow Brick Road was more dream than reality, we can sympathize with how realistic some dream experiences are.
For integrated ethylene-polyethylene producers, Emerald City is the golden era when profit margins rebound and gross profits are based on larger volumes. Margins, particularly for large integrated ethylene-polyethylene producers, will recover when global demand growth absorbs the surge in US polyethylene exports during 2019-22. The Yellow Brick Road is the economic path from second-half 2018 through yearend 2022 or 2023. As producers continue the journey along the Yellow Brick Road, they will encounter potholes and obstacles, including periods of weaker profit margins.
The journey to Emerald City began in second-half 2018 when US polyethylene exports posted a series of new record highs (October 2018, February 2019, April-May 2019) as well as when exports to destinations outside North America became the driving force for sustained growth in exports. Producers encountered the first potholes and obstacles in fourth-quarter 2018 and first-half 2019.
According to signposts at the end of the first leg of the journey, chemical producers may reach Emerald City by 2021-22. While the first leg of the journey along the Yellow Brick Road had some obstacles, and travelers had to avoid a few potholes, they didn’t encounter any rained-out bridges, and most reached the second leg of the journey in good spirits.
When we review second-half 2019 and first-half 2020, we’ll be able to identify when the second leg of the journey began. This second leg will be a period of continued deterioration in gross margins between high-density polyethylene (HDPE) and net transaction price (NTP) ethylene prices.
A few midstream companies joined producers in the journey. These companies will complete development of additional export terminal capacity in late 2019 and early 2020, and the logjam of surplus inventory will dissipate in 2020-21.
New plant start-ups
Just as Dorothy and her newfound friends encountered problems during the journey along the Yellow Brick Road, sometimes olefins producers encounter problems during commissioning. None of Louisiana’s new plants started operations in second-half 2018, and all were two or three quarters behind schedule before start-up. Indorama Ventures Olefins LLC and the Lotte Chemical USA Corp.-Westlake Chemical Corp. joint venture achieved initial ethylene production at their respective new plants in Lake Charles second-quarter 2019, but neither plant reached full capacity before the quarter’s end. Combined, these two plants increased US ethylene production capacity by 2.6 billion lb/year.
Ethylene production
Petral Consulting Co. tracks US ethylene production via a monthly survey of operating rates and feed slates. No new plants under construction in fourth-quarter 2018 reached mechanical completion in first-quarter 2019, and US ethylene capacity was unchanged at 75 billion lb/year, or 205.6 million lb/day. When Indorama and Lotte-Westlake plants started up in second-quarter 2019, they increased industry nameplate capacity to 77.7 billion lb/year, or 212.8 million lb/day.
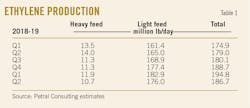
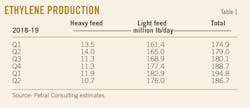
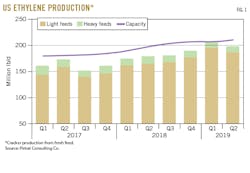
Production in first-quarter 2019 was up 195 million lb/day, or 6.1 million lb/day (3.2%) vs. fourth-quarter 2018 and 20 million lb/day (11.4%) from first-quarter 2018. Production declined 11 million lb/day (5.3%) in second-quarter 2019 to 184 million lb/day. Industry operating rates were 94% in first-quarter 2019 and 87% in the second quarter.
Operating rates for Texas plants were 94% in first-quarter 2019 and 88% in the second quarter. Operating rates for Louisiana plants were 93% in first-quarter 2019 and 85% in the following quarter (Table 1).
Fig. 1 shows trends in ethylene production.
Ethylene production costs
Ethylene production costs are determined by raw material costs and coproduct credits. Based on variations in yield patterns for the various feeds, coproduct volumes vary widely between the three categories of plants (ethane-only, LPG-only, and multifeed plants). Raw material costs are determined by each feedstock’s price and its conversion to ethylene. Similarly, coproduct credits are determined by spot prices and production volumes for each coproduct but only for those plants that upgrade all coproduct streams to meet purity specifications.
A few ethylene plants can upgrade all coproducts to purity streams and sell all coproducts at market prices. Most ethylene plants produce purity coproduct propylene but produce all other coproducts as mixtures (mixed butylene-butadiene and mixed aromatics) and sell mixtures at discounted prices. Variations in realized revenue for coproducts result in large differences in coproduct credits from one plant to another. Cash production costs are determined by simple addition of raw material costs and coproduct credits (see accompanying box).
| Feedstock prices, coproduct values, and ethylene plant yields determine ethylene production costs. Petral Consulting maintains direct contact with the olefin industry and tracks historic trends in spot prices for ethylene and propylene. We use a variety of sources to track trends in feedstock prices.
Some ethylene plants have the necessary process units to convert all coproducts to purity streams. Some ethylene plants, however, do not have the capability to upgrade mixed or crude streams of various coproducts and sell some or all their coproducts at discounted prices. We evaluate ethylene production costs in this article based on all coproducts valued at spot prices. |
Crude oil price trends are always a strong influence on prices for propane, naphtha, gas oil, and most coproducts. After falling $22-23/bbl (28-30%) in fourth-quarter 2018, prices for the major crude oil benchmarks staged a strong recovery in first-quarter 2019, with global benchmark prices reaching $66-68/bbl, or 90% of their averages in third-quarter 2018.
Although international motor gasoline and naphtha prices also increased in second-quarter 2019, their price differentials relative to crude oil remained abnormally weak vs. 3-year averages. Specifically, conventional unleaded regular gasoline price premiums (US Gulf Coast) vs. the OPEC Reference Basket (ORB) crude price average at the USGC were 24¢/gal in second-quarter 2019 compared with 2.5-6.6¢/gal in fourth-quarter 2018 and first-quarter 2019, but the 3-year average price differential vs. ORB crude prices for second-quarter 2019 was 44¢/gal.
Prices for the most important feedstocks in the USGC did not track the rebound in crude prices in first-half 2019. Naphtha prices in second-quarter 2019 were weaker relative to crude price than in fourth-quarter 2018. Specifically, USGC naphtha prices were discounted 0-4¢/gal vs. ORB prices in fourth-quarter 2018 and first-quarter 2019, with discounts widening to 10.6¢/gal in second-quarter 2019.
Comparison of prices without regard to crude oil basis values is also important. While naphtha price discounts were deeper in second-quarter 2019 than in previous quarters, spot prices reached 165¢/gal in March-April 2019 vs. 130-134¢/gal in December 2018 and January 2019. By contrast, propane spot prices at Mont Belvieu, Tex., fell to 66-68¢/gal in December 2018 through March 2019 and fell another 20¢/gal in second-quarter 2019.
Most important for USGC ethylene producers, ethane prices began declining in November 2018 to an average 34.5¢/gal in fourth-quarter 2018 (8¢/gal less than in third-quarter 2018). Prices managed to rebound in January 2019 and were 31-32¢/gal vs. 29.5¢/gal in December 2018. Spot prices for purity ethane ultimately declined by 14¢/gal during February through June. Prices in June were 17.5¢/gallon and were 44% less than in January.
These comparisons show supply-demand considerations were bearish for ethylene feedstocks, overwhelming the bullish impact of rising crude prices.
Prices for major coproducts also declined in first-half 2019 vs. third quarter 2018. Contract prices for polymer-grade propylene were 60¢/lb in third-quarter 2018 and averaged 35% less in first-half 2019 at 39¢/lb. Toluene prices in first-half 2019 were 31¢/gal (11%) less than in third-quarter 2018. Spot prices for mixed xylenes were 253¢/gal in first-half 2019, or 29¢/gal (10.2%) less than in third-quarter 2018. Contract prices for butadiene were 49¢/lb in first-half 2019, or 23¢/lb (32%) lower vs. third-quarter 2018. Coproduct credits declined in first-half 2019 as well but didn’t fall as much as spot prices for ethane and propane.
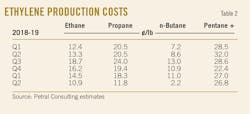
Cash production costs in first-quarter 2019 were 14.5¢/lb for purity ethane, 18.3¢/lb for propane, and 27.0¢/lb for natural gasoline. Production costs in second-quarter 2019 were lower for ethane and propane but costs for natural gasoline were almost unchanged. Production costs for purity ethane and propane were 10.9¢/lb and 11.8¢/lb, respectively, in second-quarter 2019, with production costs for natural gasoline 26.8¢/lb.
Table 2 shows production costs for major ethylene feedstock.
Ethylene pricing, profit margins
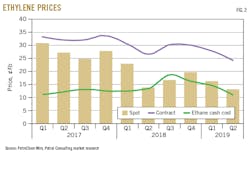
Pricing data published by OPIS PetroChem Wire showed spot ethylene prices varied by less than 1¢/lb during September-December 2018. During this 4-month period, spot prices averaged 19.7¢/lb. As production costs for ethane and propane fell, prices began falling in January 2019, declining for 5 consecutive months in first-half 2019. OPIS PetroChem Wire data showed the cumulative decline in spot prices in first-half 2019 vs. fourth-quarter 2018 was 6.7¢/lb (33.9%). On a quarterly average basis, spot prices were 16.3¢/lb in first-quarter 2019 and 13.2¢/lb in the second quarter.
During first-half 2019, ethane and normal butane were the only feedstocks that consistently produced positive profit margins. Margins for purity ethane were 1.8¢/lb in first-quarter 2019 and improved to 2.3¢/lb in the second quarter. Margins for normal butane (based on “TET” normal butane prices) fell 5.4¢/lb in first-quarter 2019. (“TET” is short for “Texas Eastern” and refers to petroleum products in Texas Eastern storage at Mont Belvieu, now owned and operated by Lone Star Partners, an operating unit of Energy Transfer Partners. “Non-TET” refers to product at Mont Belvieu but in other owners’ systems.)
Normal butane prices tracked the decline in propane prices in domestic and international markets. Cash production costs declined almost 9¢/lb from first quarter to second-quarter 2019, and profit margins improved to 10.9¢/lb in the second quarter. Even though production costs are often less than for ethane, normal butane never accounts for more than 5% of fresh feed. Normal butane demand would have to be triple or quadruple actual demand to be equivalent to propane as a percent of fresh feed. Normal butane supply in the USGC is grossly inadequate if ethylene feedstock demand was in the range of 300,000-400,000 b/d.
Consistent with five full quarters of persistently weak spot prices, monthly reports from OPIS PetroChem Wire showed the volume of fixed price trades in Texas and Louisiana fell to 3.2 million lb/day (a multiyear low) in first-quarter 2019. Although prices continued to fall, the volume of fixed-price trades increased to 5.9 million lb/day in second-quarter 2019.
What accounted for the increase in fixed-price trade volume in second-quarter 2019? None of the new plants in Louisiana scheduled to start up in fourth-quarter 2018 and first-quarter 2019 were in production until May or June, and none reached full-capacity operating rates. Three of the four new plants in Louisiana that were slated to start up belong to companies that—though new to ethylene production—were still major ethylene buyers for their derivative plants. Ethylene buyers had to increase purchases in the spot market to keep their derivatives units supplied and running at full capacity, likely explaining the unexpected surge in fixed-price trades in second-quarter 2019.
Also according to OPIS PetroChem Wire, fixed-price trades at Choctaw Dome, La., for current-month business accounted for 32% of all fixed-price trades in first-half 2019. Fixed-price trading volumes at Choctaw Dome for first forward-month business made up 27% of total business. Before 2018, trade volumes at Choctaw Dome accounted for 3-6% of fixed-price trades.
Consistent with the industry’s favorable experiences in first-half 2019, prices for all fixed-price non-TET trades maintained modest premiums vs. prices at Nova Chemical Corp.’s hub in Mont Belvieu for current-month business (0.35-0.70¢/lb) in March-May. In June, premiums vs. the Nova Chemical hub soared to 2.5-2.7¢/lb for both current and first forward-month business. Non-TET trading volume in June was higher than any previous month since February 2018 and was 21% of all current-month trades.
Enterprise Products Partners LP (EPP) converted one salt cavern (previously in ethane service) to ethylene inventory service (estimated capacity 661 million lb on a purity-ethylene basis). EPP made this change in preparation for start-up of ethylene exports via the new export terminal in the Houston Ship Channel. Companies that have signed contracts to use the ethylene export terminal will begin to transfer ethylene into the storage cavern in preparation for loading the first cargoes in fourth-quarter 2019.
With a year-over-year 7.8% increase in ethylene production in first-half 2019, the persistent decline in spot ethylene prices over the same period contributed to sustained downward pressure on NTP contract settlements. NTP settlements declined every month in first-half 2019. Settlements averaged 27.8¢/lb in the first quarter and 24.25¢/lb in the second quarter.
Fig. 2 shows historical trends in ethylene spot prices and NTPs.
Olefin-plant feed slate trends
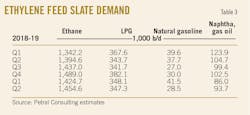
Petral Consulting’s monthly survey of plant operating rates and feed slates showed industry demand for NGL feedstocks increased in first-quarter 2019 to 1.97 million b/d. With ethylene production in second-quarter 2019 falling 10.4 million lb/day (5.3%) to 184.5 million lb/day from 194.9 million lb/day in the previous quarter, demand for NGL feeds also fell, by 85,000 b/d (4.3%) to 1.88 million b/d in the second quarter. Demand for NGL feeds in first-half 2019, however, was 69,500 b/d (3.8%) more than in second-half 2018 (Table 3).
Monomer exports
Ethylene and propylene are used as raw material feeds for production of derivative products, with polyethylene and polypropylene as the most important derivatives. US chemical companies focus primarily on selling surplus supplies of polyethylene, ethylene glycol, PVC, polypropylene, and acrylonitrile into international markets. US International Trade Commission (ITC) data showed monomer exports on a quarterly average basis ranged from zero to 1.6 million lb/day during 2015-18. Ethylene monomer exports averaged 1.47 million lb/day in first-quarter 2019 and 1.5-1.75 million lb/day in the second quarter (based on data for April-May and an estimated volume for June). Monomer exports increased in three consecutive quarters (fourth-quarter 2018 through second-quarter 2019). Monomer exports in second-quarter 2019 were 1.76 million lb/day vs. 1.27 million lb/day for the three previous quarters, averaging 0.49 million lb/day (39%) more than the earlier three-quarter average.
When EPP opens the first merchant ethylene export terminal in the USGC in fourth-quarter 2019, ethylene exports volumes will quickly increase to 5-7 million lb/day (400-600 million lb/quarter).
Polyethylene exports
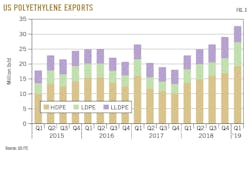
According to US ITC statistics, US exports of polyethylene—including HDPE, low-density polyethylene (LDPE), and linear low-density polyethylene (LLDPE)—have now increased for six consecutive quarters. Exports to all destinations were 32.8 million lb/day in first-quarter 2019 and 35.3 million lb/day in the second quarter. On a year-over-year basis, polyethylene exports were 10.1 million lb/day (42.4%) more than in first-half 2018.
Exports to Canada and Mexico in first-quarter 2019 were 9.9 million lb/day and 9.2 million lb/day in the second quarter. More importantly, however, exports to all other destinations (ROW) were 22.9 million lb/day in first-quarter 2019 and 26.1 million lb/day in the second quarter (Fig. 3).
On a year-over-year basis, exports to ROW destinations increased 67.5% in first-quarter 2019 and 77.8% in the second quarter. If polyethylene exports to ROW destinations increase at a sustained rate of 20%/quarter and exports to Canada and Mexico are constant, exports to all destinations will average 40-42 million lb/day by second-quarter 2020.
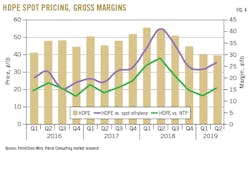
According to OPIS PetroChem Wire, spot prices for HDPE (free on board, FOB Houston) were 40¢/lb in first-quarter 2019 and 39.6¢/lb in the second quarter. HDPE price premiums vs. spot ethylene were 23.7¢/lb in the first quarter and 26.5¢/lb in the following quarter. Differentials between HDPE and NTP ethylene prices were 12.1¢/lb in the first quarter but improved to 15.7¢/lb in the second quarter.
The improvement in HDPE margins vs. NTP ethylene was another positive experience for chemical companies. The sustained growth in polyethylene exports to ROW destinations is particularly important, as the rebound in margins vs. NTP prices reinforced the gains of the previous six quarters (Fig. 4).
Propylene supply
Olefin-plant coproduct supply. Coproduct propylene supply depends primarily on the use of propane, normal butane, naphtha, and other heavy feeds. In first-half 2019, monthly survey results showed demand for LPG feeds (propane and normal butane) was 345,000-355,000 b/d, while demand for heavy feeds was 120,000-130,000 b/d. Combined, demand for LPG and heavy feeds was 12,000 b/d less than in second-half 2018.
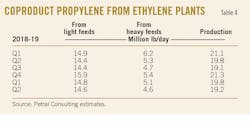
Based on the demand decline for these feeds, we might anticipate coproduct propylene supply also declined in first-half 2019, and we would be correct. Coproduct propylene supply from all feeds was 19.6 million lb/day in first-half 2019, or 0.63 million lb/day (3.1%) less than in second-half 2018. Coproduct supply of aromatics from LPG and heavy feeds was 19.1 million lb/day in first-half 2019 or 0.68 million lb/day (3.5%) less vs. second-half 2018. Coproduct supply from ethane (“ethane only” and LPG plants), however, was 4.1 million lb/day in first-half 2019, or 0.30 million lb/day (8.0%) more than in second-half 2018 (Table 4).
PDH plant supply. Based on OPIS PetroChem Wire daily reports and other industry sources, Petral Consulting estimates propylene production from propane dehydrogenation (PDH) plants at the USGC. Three plants with a combined capacity of 13 million lb/day were operational in first-half 2019. From an all-time high of 12 million lb/day in second-half 2018, Petral Consulting estimates production in first-half 2019 was 9 million lb/day (70% of industry nameplate capacity).
As of July 2019, no additional USGC PDH capacity is slated to come on stream for the next 3 years. In December 2018, EPP announced it had revived plans for a second PDH plant in Mont Belvieu. PetroLogistics ll LLC also recently unveiled plans to build a new USGC PDH plant, which is now in front-end engineering and design (OGJ Online, July 15, 2019). PetroLogistics II has yet to choose a specific USGC location for the project but has licensed Dow Chemical Co.’s proprietary fluidized catalytic dehydrogenation (FCDH) technology.
Although none of the PDH plants in commercial operation use FCDH technology, Dow’s reactor design is based on fluid catalytic cracking unit (FCCU) technology widely used by refineries. According to Dow, FCDH will reduce capital investment and overcome operational stability issues. FCDH technology also can be used to retrofit existing PDH plants and improve on-stream factors.
Refinery supply. Refinery propylene sales into the merchant market are a function of:
- FCCU feed rates (most important variable).
- FCCU operating severity (important but not directly measurable).
- Economic incentive to sell propylene rather than use it as alkylate feed. Variations in FCCU feed rates generally are the most important parameter determining refinery-grade propylene supply. Economic factors that may result in changes in operating severity are generally of secondary importance.
Based on EIA statistics, fresh feed to FCC units was 3.3 million b/d in first-quarter 2019 (180,000 b/d and 5.2% less than fourth-quarter 2018). Based on EIA monthly statistics for April 2019 and weekly statistics for May and June, Petral Consulting estimates FCCU feed rates increased by 211,000 b/d in second quarter and averaged 4.8 million b/d in the second quarter.
Statistics from the US Energy Information Administration (EIA) show USGC and Midcontinent refineries operated FCCUs at 3.28 million b/d in first-quarter 2019 and 3.3 million b/d in the second quarter. According to EIA monthly statistics for 2010-17, FCCU feed rates usually increase by 200,000-300,000 b/d from first quarter to second quarter. In 2019, however, refineries in the US Midcontinent had persistent operational problems in the second quarter, with refinery run rates—including FCCU feed rates—almost unchanged between quarters.
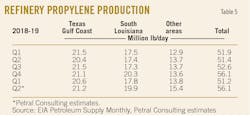
Refinery-grade propylene supply from USGC and Midcontinent refineries fell to 47.9 million lb/day in first-quarter 2019. Even though FCCU feed rates were almost unchanged in second-quarter 2019, refinery-grade propylene supply increased to 49.7 million lb/day. USGC merchant sales—which include all supply from USGC and Midcontinent refineries—in first-half 2019 was 2.0 million lb/day (3.9%) less than in second-half 2018 (Table 5).
US supply. EIA statistics for refinery-grade propylene and Petral Consulting estimates for coproduct supply and PDH plant production show total USGC propylene supply was 76 million lb/day in first-quarter 2019 and increased to 78 million lb/day in the second quarter. Supply from all sources in first-half 2019 was 77 million lb/day, down 4.5 million lb/day (5.5%) from second-half 2018.
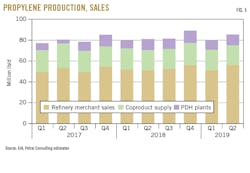
Fig. 5 shows trends in coproduct supply, PDH plant production, and refinery merchant sales of propylene.
Propylene economics, pricing
Propylene inventory in reportable USGC storage on July 1, 2018, was 583 million lb, 129 million lb below the 3-year average (712 million lb). Inventory increased gradually in August-September and then at much faster rates in fourth-quarter 2018 and first-quarter 2019, reaching a peak of 1.4 billion lb on Mar. 1, 2019. Within a short span of 5 months, inventory was 2.2 times more than on Oct. 1, 2018. During the previous 8 years (2010-17), inventory had never exceeded 1 billion lb and reached 700 million lb or more only one-third of the time.
In third-quarter 2018, before inventory began its unprecedented surge, spot prices for refinery-grade propylene were 42-46¢//lb, with premiums vs. unleaded regular gasoline 9-13¢/lb. As inventory increased to its record high on Mar. 1, 2019, downward pressure on refinery-grade propylene spot prices intensified, with prices in March 2019 falling to 20¢/lb, or 56% lower than September 2018. Prices in March 2019 also fell to a discount of 9¢/lb vs. unleaded regular gasoline.
Spot prices for refinery-grade propylene remained discounted relative to unleaded regular gasoline for the balance of first-half 2019 and into the third quarter. Based on OPIS PetroChem Wire’s daily reports, prices were 23.1¢/lb in first-quarter 2019 and 23.2¢/lb in the second quarter, while first and second-quarter 2019 discounts to unleaded regular gasoline were 2.4¢/lb and 6.9¢/lb, respectively.
As refinery-grade propylene prices collapsed, prices for polymer-grade propylene initially were steady. The bearish influence of surging inventory in fourth-quarter 2018 and first-quarter 2019, however, became too intense. Spot prices for polymer-grade propylene in December 2018 fell to 37.7¢/lb, or 20.7¢/lb less than in August 2018, OPIS PetroChem Wire reports showed. Prices continued falling in first-quarter 2019 to average 32.4¢/lb in March. As inventory began falling in April and downward price pressures eased, the general rebound in petroleum products prices limited further erosion in spot prices for polymer-grade propylene. Prices were 34.7¢/lb in first-quarter 2019 and 35.5¢/lb in the second quarter.
In the current market, unpredictable variations in supply-demand balances result in large swings in polymer-grade propylene pricing and differentials. The unpredictable variability in operating rates of the USGC’s three PDH plants will continue to influence spot prices for polymer-grade and refinery-grade propylene. For propylene producers—in contrast to the relatively smooth path of ethylene producers—the journey in first-half 2019 was like a wagon ride on a dark night along a dirt road with deep ruts and many potholes.
Propylene, polypropylene exports
A reasonable person would ask why first-half 2019 was so difficult for propylene producers. Was a slump in propylene-monomer exports the primary cause? We know supply from PDH plants—the only on-purpose source of supply—was 3 million lb/day lower in first-half 2019 than in second-half 2018, but year-over-year propylene inventory surplus was almost 500 million lb in first-half 2019. At liquidation rates of 3 million lb/day, the inventory surplus was equal to about 5 months’ supply.
Primary destinations for monomer exports are usually Colombia and Mexico. Exports to Mexico were 1.70 million lb/day in first-quarter 2019 and 1.9 million lb/day in the second quarter, with total exports to Mexico in first-half 2019 unchanged from second-half 2018. Exports to Colombia were 1.9 million lb/day in first-half 2019, or 0.33 million lb/day (21.1%) more vs. second-half 2018.
US ITC statistics also showed US polypropylene exports strongly recovered in first-half 2019 to 6.4 million lb/day, or 1.2 million lb/day (22.2%) more than in second-half 2018. Mexico and Europe were important destinations providing support for the recovery.
Second-half 2019 outlook
In 2018 domestic ethylene producers increased polyethylene exports at a faster rate than most analysts had anticipated.
Petral Consulting previously forecasted that US ethylene production would average 190-210 million lb/day in first-half 2019 and 200-220 million lb/day in second-half 2019 (OGJ, June 3, 2019, p. 41). Production in first-half 2019 was at the low end of the range, with second-half 2019 production most likely to average 195-205 million lb/day.
Based on strong performance of polyethylene exports in first-half 2019, growth rates for exports are likely to be slower in second-half 2019 as polyethylene producers in other regions react to inroads in markets in South America, Asia and other regions other than North America.
The author
Daniel L. Lippe ([email protected]) is president of Petral Consulting Co., which he founded in 1988. He has expertise in economic analysis of a broad spectrum of petroleum products including crude oil and refined products, natural gas, natural gas liquids, other ethylene feedstocks, and primary petrochemicals.
Lippe began his professional career in 1974 with Diamond Shamrock Chemical Co., moved into professional consulting in 1979, and has served petroleum, midstream, and petrochemical industry clients since. He holds a BS (1974) in chemical engineering from Texas A&M University and an MBA (1981) from Houston Baptist University. He is an active member of the Gas Processors Suppliers Association.
