US construction plans slide; pipeline companies experience flat 2003, continue mergers
The US natural gas pipeline system appears headed for serious delivery-capacity constraints, if recent proposals are any indication.
For the 12 months ending June 30, 2004, formal plans brought before the US Federal Energy Regulatory Commission for new or expanded pipeline and compression dropped like a rock compared with plans filed in the previous 12-month period (OGJ, Sept. 8, 2003, p. 60), and those were themselves off sharply from plans filed up to June 30, 2002 (OGJ, Sept. 16, 2002, p. 52).
This trend seems to evince last month's dire warnings from the Interstate Natural Gas Association of America about the critical need for additional infrastructure (see accompanying sidebar, p. 54, and OGJ, July 26, 2004, p. 7).
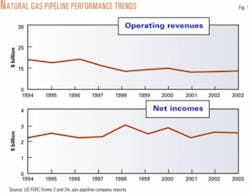
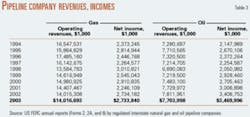
For the calendar year ending Dec. 31, 2003, however, US natural gas pipeline companies reported very solid returns in annual reports to FERC, many of which were only submitted in second quarter 2004.
Annual reports to FERC for 2003 for US oil pipelines, however, paint a distinctly different picture: revenues, incomes, throughput (bbl-miles), and volumes delivered were all flat or down last year.
Click here to view Oil Pipelines in PDF.
Click here to view Gas Pipelines in PDF.
Much of the merger and acquisition activity in the last 1-3 years, especially among oil pipeline companies, reflects some companies' desire to get out of a business with underperforming assets and other companies' desire to snap up those assets at bargain-basement prices.
Oil & Gas Journal has revived this year its list of realigned, renamed, bought, sold, and otherwise new, revived, or deceased companies, based on FERC information and public documents: See accompanying sidebar, p. 56.
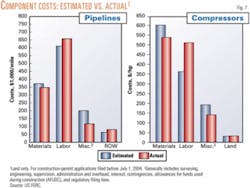
And despite the skyrocketing price of steel used to manufacture line pipe, actual-cost statements filed with FERC for the 12 months ending June 30, 2004, were generally in line with or lower than estimates at the time projects were proposed to FERC.
Information sources
Data in this exclusive, annual report on federally regulated interstate natural gas and oil pipelines come mostly from publicly available information from FERC and fall into two broad categories:
1. Data from annual reports filed by regulated oil and natural gas pipeline companies with FERC for the previous calendar year.
Such pipeline companies that, in FERC's view, are involved in the interstate movement of oil or natural gas for a fee fall under FERC jurisdiction, must apply to it for approval of its transportation rates, and therefore must file a FERC annual report: Form 2 or 2A, respectively, for major or nonmajor natural gas pipelines; Form 6 for oil (crude or product) pipelines.
The distinction between "major" and "nonmajor" is defined in the note to the long table listing all FERC-regulated natural gas pipeline companies for 2003 at the end of this article (p. 72).
The deadline each year is Apr. 1. For a variety of reasons, many companies miss that deadline, apply for extensions, but eventually file a report. OGJ begins in March requesting copies of these reports directly from the companies and searching public databases at FERC for them.
That deadline and the numerous delayed filings explain why publication of this OGJ report on pipeline economics occurs in the third quarter of each year. Earlier publication would preclude many companies' information.
2. Data from periodic filings with FERC by those regulated natural gas pipeline companies wanting to expand capacity that FERC must approve. OGJ keeps a record of those filings during each 12-month period ending June 30 of each year.
When a FERC-regulated natural gas pipeline company wants to modify its system, it must apply for a "certificate of public convenience and necessity." This filing must explain in detail the planned construction, justify it, and—except in certain instances—specify what the company estimates the construction will cost.
Not all applications are approved; not all that are approved are built. But, assuming a company receives its certificate and builds its facilities, it must—again, with some exceptions—report to FERC how what it actually spent compares with what it estimated to spend.
OGJ spends the year July 1 to June 30 monitoring these filings, collecting them, and analyzing their numbers.
What we learn
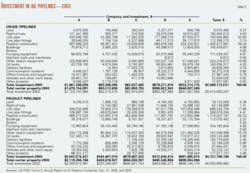
At the end of this article (p. 68), two large tables present a variety of data on US pipeline companies: revenue, income, volumes transported, miles operated, and investments in physical plants. For 2001 (OGJ, Sept. 16, 2002, p. 52), OGJ began reporting what natural gas pipeline companies spent during the year on operations and maintenance.
How the US natural gas transmission industry has evolved under less regulation is revealed in a review of the table on natural gas companies. This annual report began tracking volumes of gas transported for a fee by major interstate pipelines for 1987 (OGJ, Nov. 28, 1988, p. 33) as pipelines moved gradually after 1984 from owning the gas they moved to mostly providing transportation services.
Volumes of natural gas sold by pipelines have been steadily declining, so that, beginning with 2001 data in the 2002 report, the table only lists volumes transported for others.
The company tables have also reflected the recent asset consolidation and merger activity among companies in their efforts to improve transportation efficiencies and increase bottom lines.
Analysis
Comparing annual US petroleum and natural gas pipeline data, especially mileage, has been made difficult by reporting changes over the years. For any calendar year, for example, which companies must file reports with FERC may vary, as some companies become jurisdictional, others non-jurisdictional, and still others merge or consolidate out of existence.
FERC installed its two-tier classification system for natural gas pipeline companies, noted previously, for 1984 (OGJ, Nov. 25, 1985, p. 55) and has further complicated comparisons.
Definitions of the categories can be found at the end of this article, as mentioned, and in FERC Accounting and Reporting Requirements for Natural Gas Companies, para. 20.011.
Only FERC-defined major US gas pipelines are required to file miles operated in a given year. Nonmajor companies may indicate miles operated as part of a general description of their operations but are not specifically required to. Since 1984, more companies have included descriptions of their systems, including miles of pipeline operated.
Reports for 2003 show 68 major gas pipeline companies of 110 pipelines reporting, equal with information for 2002: 68 of 112 companies, up from 63 of 110 companies filing for 2001, and 61 major companies among 113 filing for 2000.
More changes for natural gas pipeline reporting came for 1996: Major natural gas pipeline companies were no longer required to report miles of gathering and storage systems separately from transmission.
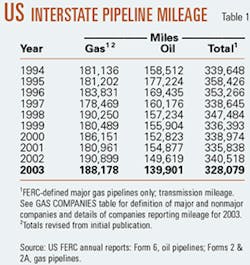
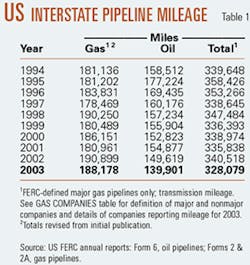
Thus, total miles operated for gas pipelines consist almost entirely of transmission mileage. To continue to convey a reliable 10-year trend, OGJ adjusted Table 1 to reflect only transmission mileage operated since 1993 and only for major pipeline companies.
Reporting requirements for oil pipelines, which include crude oil and petroleum products, underwent a change for 1995 (OGJ, Nov. 25, 1996, p. 39). FERC made an additional change.
Those pipelines whose operating revenues have been at or less than $350,000 for each of the 3 preceding calendar years became exempt from requirements to prepare and file a Form 6.
These companies must file only an "Annual Cost of Service Based Analysis Schedule," which provides only total annual cost of service, actual operating revenues, and total throughput in both deliveries and barrel-miles.
Whether FERC designates an oil pipeline company an interstate common-carrier pipeline determines whether the company must file an annual report.
Click here to view Notable US Pipeline Ownership Changes in PDF.
Activity; rankings
"I do not believe you are seeing a movement away from pipeline usage."
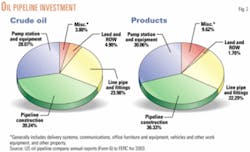
Fig. 2 illustrates the investment split in the crude oil and products pipeline companies.
Construction clouds
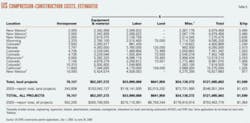
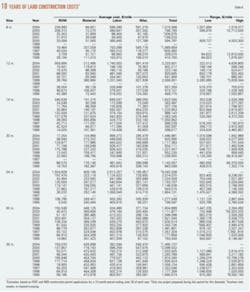
Those tables cover a variety of locations, pipeline sizes, and compressor-horsepower ratings.
The trend is unmistakable and, given projections for US natural gas demand growth, frightening.
Again, the trend is unmistakable:
- Plans proposed during 2003-04 were barely one third of the compression applied for a year earlier.
- Again for the 2003-04 period, more than 70% of the total amount of compression applied for is for added capacity at stations, in line with the more than 75% of compression applied for 2002-03 that was for added capacity.
- 37 land and 2 marine projects (OGJ, Sept. 8, 2003, p. 60).
- 83 land and 3 marine projects (OGJ, Sept. 16, 2002, p. 52).
- 49 land and 2 marine projects (OGJ, Sept. 3, 2001, p. 66).
- 115 land and 6 marine projects (OGJ, Sept. 4, 2000, p. 68).
- 39 land and no marine projects (OGJ, Aug. 23, 1999, p. 45).
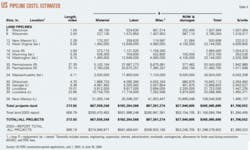
For the 12 months ending June 30, 2004, the 15 land projects would cost more than $365 million.
Materials can include line pipe, pipe coating, and cathodic protection.
ROW costs include obtaining rights-of-way and allowing for damages.
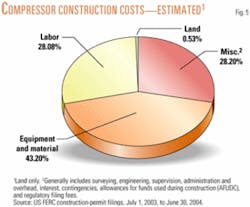
Fig. 5 shows the cost split for land compressor stations based on data in Table 5.
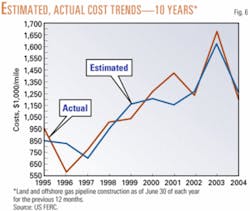
Fig. 6 shows 10 years of estimated vs. actual costs on cost-per-mile bases for project totals.
The 12 months ending June 30 saw completed-project cost filings for 1,200 miles, down from nearly 1,250 miles of pipeline at June 30, 2003, which included more than 430 miles of the completed Gulfstream offshore pipeline, and almost 468,000 hp of new or additional compression.
Click here to view US Pipeline Costs: Estimated vs Actual (Table 7) in PDF.
Correction
Table 7 of the Pipeline Economics Report (OGJ, Aug. 23, 2004, p. 52) contained incorrect totals. Above are the corrected totals:
Click here to view US Compressor-Station Costs (Table 8) in PDF.
Overall, actual land gas pipeline construction costs came in under originally estimated costs by about $69 million. Table 8, on the other hand, shows that actual costs for installing compression exceeded estimated ones by about $15 million.
