Method developed for benchmarking pipeline operators' performance
Hank Brolick, Roger Holden, Rick Jones
A new and more accurate divisor has been developed that better reflects the diversity in pipeline capacity and complexity.
Called Equivalent Pipeline Complexity (EPC), the method is a result of a comparative performance analysis by Solomon Associates, Dallas, of pipeline, terminal, and marine operations commissioned by a group of seven European oil pipeline companies in 2000 (OGJ, Oct. 14, 2002, p. 64).
The earlier article described a method for comparing cash operating expenses using replacement value as the prime divisor for the European study. While replacement value represents a marked improvement over traditional divisors, such as bbl-miles (tonne-km), Solomon was not satisfied that replacement value adequately represented pipeline capacity and complexity.
Subsequent studies begun in 2002 for Europe, Latin America, and North America produced greater industry participation and enabled a more extensive data analysis.
The new divisor results from the increased data pool and continued research.
Designing the study
Solomon has developed an approach to defining the scope of a study, as well for collecting and validating the data.
Development of a meaningful divisor such as EPC requires that data from which it is based be accurate and reliable. As such, in design of a benchmarking study, one of the major issues to be addressed is the definition of the envelope. The core operational activities of the pipeline(s) must be well-defined and the data should relate solely to those activities.
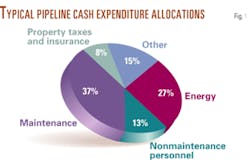
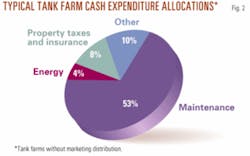
Additionally, one must consider the difference in operating cost structures of pipelines and tank farms (Figs. 1 and 2). Many pipeline systems have little or no tankage, whereas others have substantial tankage and even marine loading and unloading facilities.
The differences become even more pronounced when the tank farms include road and rail marketing and distribution of products. Accounting for differences in cost structures involved collection of operating expense data on a modular basis—for pipelines, tank farms, and terminals. Clearly defining the pipeline envelope better represents a particular pipeline's capacity and complexity and allows for the development of a more-accurate divisor and a more-detailed analysis.
Collecting, validating data
A well-designed study involves a balance between collecting only valid information that is relevant to the business and collecting enough data to allow sufficient flexibility and effectiveness in the analysis.
While enterprise software facilitates the collection of detailed data, collecting the "right" data is vital to the design of the study. Collecting only relevant data avoids prolonged collection and analysis times.
Should enterprise software not be available and detailed costs have to be derived through allocation based on a divisor, an appropriate divisor such as EPC must be used to ensure that the allocation is accurate and that further analysis is meaningful.
Other types of information collected in a well-designed study include reliability and pipeline integrity data to ensure a robust and comprehensive view of the operation. Determining the relationships between maintenance or integrity program spending and reliability adds another useful dimension to benchmarking results.
Trends in such relationships that are monitored over a succession of studies make outcomes very useful for modifying or improving performance.
Rigorous validation is the cornerstone of credible benchmarking. Without valid data, any insights and conclusions gained from the analysis can be seriously flawed. Benchmarking experience suggests that data validation should be performed in two ways:
- Sophisticated cross-checks in the data input forms.
- Manual inspection and evaluation by experienced engineers and consultants.
This approach ensures the accuracy and consistency of data prior to any analysis. Combined with relevant and well-defined data, providing rigorous validation increases the accuracy of the data, promotes confidence in the development of EPC, and minimizes spurious results.
The right divisor
Pipeline operators have long been frustrated by simple divisors used to compare the performance of diverse systems, such as bbl-miles (tonne-km), which, when applied to the costs, do not accurately represent performance.
Pipeline operators have been skeptical of comparisons with other systems that do not closely match their type of service, length, diameter, terrain, region, and throughput.
Historically, there has been no universal divisor to compare diversity within the industry while accurately reflecting performance. The use of replacement value showed a marked improvement over other historical divisors; Solomon was still not satisfied with the results it provided, however. Hence, the methodology it uses in other industries was applied to the pipeline industry to develop a divisor that adequately represented pipeline capacity and complexity.
A primary consideration was the continued need for means to address fixed cost components of pipelines and terminals and to account for pipeline system diversity.
Fixed-cost components
Existing measures—commonly used within the industry to make cost comparisons—were evaluated in terms of their representation of actual operating costs. The first step involved determining the correlation between a measure (e.g., bbl-miles) with nonvolume expenditures (NVE), which includes general and administrative expenses and maintenance capital.
Predicted costs were then developed using this relationship by comparing actual NVE with predicted NVE, a mechanism was developed with which to assess how accurate a divisor is as a measure to predict operating costs.
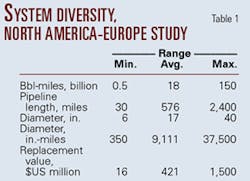
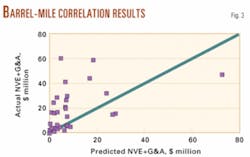
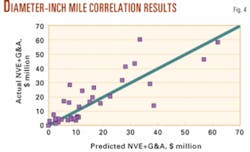
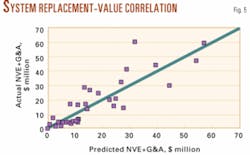
Relationships for three divisors were calculated with data from 35 pipeline systems (Table 1): bbl-miles, diameter in.-miles, and system replacement value.
Figs. 3-5 plot actual vs. predicted NVE for these divisors, respectively.
null
null
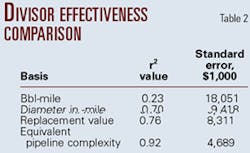
For each of the relationships, the Coefficient of Determination (r2), where "r" is the Pearson Correlation Coefficient between the actual and predicted expenditures, and standard error were developed to measure the robustness of the correlation.
The higher the r2 value, the greater the degree to which the divisor explains the variation in the correlation. Additionally, the lower the standard error, the less the dispersion in the data. The higher the r2 and the lower the standard error, the better the divisor.
Table 2 shows the relevant r2 values and standard errors for the three divisors under consideration. Utilized capacity, expressed in terms of bbl-miles (tonne-km), is not an adequate divisor because of the low r2 and high standard error compared to the other divisors. Replacement value and diameter in.-miles are better predictors because of the greater r2 values and lower standard errors.
Accounting for diversity
The operating cost divisor must account for a wide range of factors accurately to compare pipeline configurations and operations. Table 1 illustrates the diversity that exists in principal operating parameters with the 35 systems (18 North American and 17 European).
Of these systems, 19 transport crude oil, whereas the remaining 16 transport products. Of the crude oil systems, 3 have mixed use, shipping some products in the same or separate pipelines. With respect to bbl-miles, the largest participating system is about 300 times the size of the smallest. On a diameter in.-mile basis, the range between smallest and largest is 100 times.
Table 1, however, does not account for all diversity. Other factors involve the nature of the terrain (i.e., elevation changes, degree of urban development, geological features), which must be accounted for to enable an accurate comparison of performance costs.
More-accurate comparison
The pursuit of a more accurate comparison basis for pipelines (i.e., EPC) began with listing the factors that contribute to differences in fixed expenditures, or NVE. Typical physical characteristics included pipeline length, diameter, horsepower (kw), and terrain factors, which can influence maintenance cost.
Operating characteristics such as bbl-miles, average haul, and liquid type—which influence costs of batching, interface changes, and handling viscous liquids—were also considered. It should be noted that including a factor for liquid type normalizes the cost structure differences between products and crude oil systems and a larger database becomes available for analysis.
More than 20 characteristics in describing a pipeline system and how it is operated have been identified and considered in the development of EPC.
Additional analysis and a more extensive database will eventually allow the number of factors to be reduced to only those required to produce a repeatable and statistically valid EPC to help minimize data collection time.
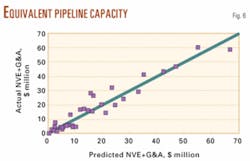
With the data for the 35 pipeline systems, some, but not all, of the more than 20 identified factors contributed to the creation of EPC to predict total NVE. Fig. 6 compares actual and predicted NVE if EPC is used. The statistics for this relationship (Table 2) indicate a much greater r2 (i.e., 0.92) and a lower standard error (i.e., $4,689,000) than was achieved compared with the other divisors.
In other words, 92% of the variability in NVE among the study participants can be explained by the factors that comprise EPC. The higher Coefficient of Determination and lower overall standard error compared with that of the other simplified divisors clearly indicates that EPC is a superior measure for predicting NVE.
Tankage, marine facilities
Although relevant to pipeline systems, this new approach has been applied to tank farms, terminals, and marine loading and unloading facilities.
EPC has been scaled so that the average tank farm or terminal fixed operating cost is of the same ratio as the pipeline EPC. Using this approach, Solomon can construct a total system EPC encompassing pipeline, tankage, and marine facilities, as applicable. Total system NVE comparisons can be made regardless of system configuration.
This work results in a more accurate measure for pipeline system complexity and capacity. Additionally, analysis has shown a valid comparison for pipeline systems that use a mix of personnel.
Representing complexity, capacity
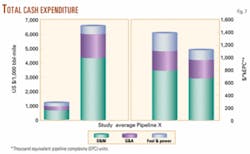
Comparing other divisors to EPC best demonstrates the impact of using an inferior divisor when comparing costs. Fig. 7 shows Total Cash Expenditures and their cost components on a bbl-mile basis and an EPC basis for "Pipeline X" as well as an average for the 35 North American and European systems.
The left scale in Fig. 7 shows expenditures in three cost segments based on the bbl-mile measure. The right scale shows expenditures on an EPC-basis. In the left scale, "Pipeline X" costs exceed study average by five times, whereas "Pipeline X" costs are lower than the study average.
Because it was previously shown that EPC is more accurate than bbl-miles, a certain degree of error may result in any decision made on the basis of bbl-miles.
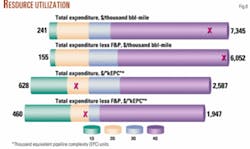
A comparison of the relative performance using both divisors also illustrates the differences in results. Fig. 8 compares total expenditures and total expenditures less fuel and power (F&P) for a pipeline system with high complexity (in terms of pipe length and number of receipt and delivery stations, for example) and a low average haul distance on two different bases, bbl-miles and EPC.
The median shown by the color change divides the performance of the number of participants into quartiles. With bbl-miles, the cost performance of the pipeline is clearly in the fourth quartile on both total expenditures and total expenditures less F&P.
Conversely, with EPC, the pipeline is a second quartile performer on these measures.
Fig. 8 indicates the pipeline is in the fourth quartile, suggesting that the complexity and low average haul distance are not accurately reflected in the performance on a bbl-mile basis. Conversely, the same pipeline is a second-quartile performer on an EPC basis, which has accounted for the multiple characteristics of the pipeline system.
Of course, an EPC-based analysis might also result in a less-favorable ranking for a pipeline; however, EPC represents the most satisfactory of all divisors considered, and thus, a basis for improvement planning.
EPC, personnel costs
Personnel is one of the principal controllable pipeline expenditures. Personnel-expenditure comparisons are typically not sufficient, however, as personnel unit costs can vary widely from region to region, and the use of contract services varies from operator to operator.
Consequently, in addition to expenditure details, it is important to collect work hours per year for both employees and contractors. Such collection allows for the comparison of pipeline systems that use a different mix of employees and outsourced services.
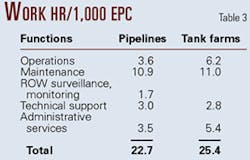
Varying patterns of personnel emerge when placing these costs on an EPC basis (Table 3) for pipeline and tankage operations. These variations suggest that the functions should be treated differently when decisions are made.
Solomon, therefore, suggests that costs for large tank farms within the pipeline system be collected as a separate data set for a more-accurate "drill down" analysis.
Figs. 7 and 8 and Table 3, for both operating costs and personnel work hours, illustrate that it is possible to compare the operating costs of diverse pipeline systems and reliably to predict cost targets based on EPC that may be used as a tool in pipeline planning and budgeting.
The EPC measure enables a credible performance comparison between systems of diverse characteristics (small or large pipelines, simple systems or branched networks, and pipelines carrying multiple grades of products or crude oils).
The EPC methodology results in more reliable key performance indicators, performance rankings, quartile positions, gap analyses, peer group comparisons, and comparisons to cost averages of best performers.
The equations for EPC are likely to evolve with changing expenditure patterns. Planning is under way on worldwide liquid pipeline studies by region for 2005.
An energy efficiency index is being developed through correlation of certain pipeline design and operating characteristics to variable costs, which are primarily energy and drag reducing agent costs.
Additionally, the concepts developed for liquid pipelines most certainly apply to natural gas pipelines. Plans are under way to perform natural gas pipeline studies in 2005 and 2006 using the same proven methodology.
The authors
Hank Brolick (hank.brolick @solomononline.com) is vice-president of pipeline with Solomon Associates in Dallas. He has over 30 years of corporate, project management, and engineering experience in the pipeline industry. Brolick was formerly President of Williams Technologies and Black Mesa Pipeline. He holds an MBA and BS in civil engineering.
Roger Holden (roger.holden @solomononline.com) has been a consultant with Solomon Associates in London for 10 years. He has 37 years of experience in the downstream oil industry in Europe. He holds a BSc in chemical engineering from the University of Nottingham, UK,.
Rick Jones (rick.jones @solomononline.com) has been the director of statistics and risk modeling in Solomon Associates' Dallas office for the last 2 years. He previously with Solomon's parent company for 9 years. Jones has considerable experience in corporate-level industrial risk management and currently demonstrates benefits and uses of corporate data for new products and services. Jones has authored several books.
