Study improves subsea pipeline preheating
Zongming Yuan
Yong Wang
Ying Xie
Southwest Petroleum University
Kemin Dai
Liang Ming
China Petroleum Engineering Co., Ltd.
Southwest Co.
Chengdu, China
A higher flow rate at lower temperatures can more effectively preheat subsea crude oil pipelines than currently used techniques. This article found that a 350-cu m/hr flow rate combined with an inlet temperature of 65.2° C. was most efficient for the pipeline studied, taking almost half as long as a 150-cu m/hr flow rate combined with an 81.6° C. inlet temperature.
This article also presents a model for determining optimum lower temperature preheating for other systems and verifies its accuracy with field data.
For a buried hot oil pipeline that is either newly constructed or restarted after a long shutdown, pipe temperature remains consistent with surrounding soil temperature: below pour point and much cooler than the heated oil. A preheating medium should be used on these pipelines before transporting hot crudes to maintain a smooth temperature field between the pipe and surrounding soil. Hot water usually serves as the preheating medium because of its high specific capacity, low viscosity, and easy accessibility.1 2
Preheating is a complex process incorporating unstable heat transfer among the preheating medium, pipe walls, soil, and atmosphere.3 Adopting an analytical or numerical method allows intensive research on the preheating of onshore buried pipelines.4-7 The rapid development of computer technology has seen numerical methods including FDM,4 8 FEM,9 10 and FVM2 3 become the primary calculation methodologies for solving the heat-transfer problem of pipelines. These methods, however, require researchers to be experienced, causing difficulty in field implementation.
Olga software is a transient multiphase flow simulator that provides insights into flow behavior from reservoir pore through to processing. A simplified and vivid graphical user interface provides convenience and flexibility. Due to its wide applications, including flow analysis, slug tracking,11-13 compositional tracking,14 pigging,15 16 flow assurance,17 and advanced thermal modeling, Olga has become the industry standard for dynamic multiphase flow simulation.
The version including the finite-element method thermal (FEMTherm) module models transient heat transfer where one or more pipelines are enclosed in a solid medium or an outer fluid pipe. Based on heat-transfer analysis, this module is very useful when the surrounding soil of a pipe cannot be considered stable. Few have applied this module to modeling the preheating process, but there is reason to believe that Olga with the FEMTherm module can study the hot water temperature on any location of a buried pipeline at any time during the preheating process.
This article uses the structure of two subsea pipelines in China to develop an Olga model for simulating the preheating process. Comparing the calculated value with the field data allows verification of the model's accuracy and optimizing process parameters subject to the first offshore platform's rated thermal load.
Process description
The pipelines in the offshore field consist of two parts: the first connects Platform A to Platform B while the second part connects Platform B to the onshore terminal (Fig. 1). They both needed to be preheated before being put into service. A bypass at Platform B linked the two parts during preheating. Hot water provided by Platform A (250 cu m/hr, 70° C.) preheated the first subsea pipeline. Platform B (100 cu m/hr, 80° C.) began warming the downstream pipelines once the preheating water from Platform A arrived.
The onshore terminal received and handled injected water from Platforms A and B. Pigs isolated the cool water already in the line from the new hot water. The cool water in the first subsea pipeline was discharged at Platform B to reduce onshore water disposal at the terminal.
Model description
Fig. 2 shows the OLGA model built to simulate pipelines in the offshore field. P-2 and P-5 are the first and second pipe sections to be preheated. S-1 and S-2 are the hot water sources at Platforms A and B, respectively. Pig 1, launched at the beginning of P-2 when S-1 begins water supply, separates the preheating medium from the cool water already in the pipe. Pig 1 is trapped at the last section of P-2. Pig 2 performs the same function in P-5.
V-1 and V-2 represent valves installed at the first section of the discharge pipe (P-3) and bypass pipe (P-4), respectively. They control whether liquid is transported towards the onshore terminal or is discharged by P-3. V-1 doesn't close, with V-2 staying closed until Pig 1 reaches the last section. Once Pig 1 is trapped, V-2 turns on and P-5 starts preheating, using both S-2 and the upstream flow.
Fig. 3 shows the pipeline structures. The subsea pipeline consists of two steel pipes with different diameters. Between the insulation and the casing pipe, a thin annular air gap exists. Table 1 shows detailed parameters.
FEM module
The FEMTherm module of Olga consists of a grid generator and a finite-element method (FEM) equation solver. The grid generator creates a 2D unstructured triangular mesh in accordance with the Delaunay criterion for discretizing the computational region.
A key value denoting the node numbers along the computational domain's largest circumference in multiples of 32 manually sets the model's mesh fineness. The typical value for this key varies from 128 to 640 in FEMTherm. The higher the mesh fineness, the more precise the calculation result and the longer the computation time. This article used a value of 160.
Researchers generally transfer the semi-infinite region to a finite thermal influence region to simplify the calculation domain surrounding buried pipelines.18-19 The thermal influence region in X and Y direction is typically not beyond 10 m.18 20 A 20 m × 10 m rectangular region therefore served as the soil computational region for this article. Figs. 4-5 show the mesh generated automatically for buried pipelines by FEMgrid. Only P-2 and P-5 were modeled as buried pipes; the rest were modeled in accordance with the corresponding ambient conditions, i.e. sea or air.
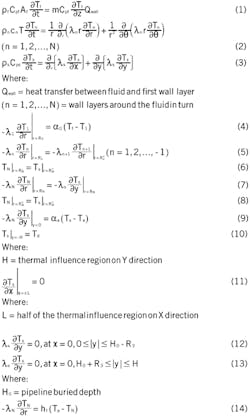
The FEM equation solver aims to solve the heat-transfer equations using the finite-element method. Equations 1-3 govern the mathematical model of dynamic heat transfer for the fluid, pipe walls, and the solid medium, respectively. For the double insulated pipe described in this article, N=4, while n=1, 2, 3, 4 stand for the inner steel pipe, insulation, air gap, and outer steel pipe, respectively.
Equation 4 describes the interface between the fluid and inner pipe wall, Equations 5-6 the interface between the pipe wall layers, and Equations 7-8 the interface between the outermost pipe wall and the surrounding soil (r = RN).
Equation 9 portrays the upper boundary of the computational domain (y = 0), Equation 10 the lower boundary of the computational domain (y = -H), and Equation 11 the left and right boundary of the computational domain (x = ±L). Equations 12-13 describe additional parameters related to depth of ground cover.
Pipelines exposed to the sea or air don't require the governing equation for soil, with Equation 14 expressing the matching conditions for the outermost layer and the ambient medium.
The combination of fluid and wall temperature equations along the pipelines and the heat-transfer equations in each of the cross sections results in a three-dimensional temperature field in FEMTherm. In using FEM for discretizing the soil region, the heat transfer equations are coupled to and solve simultaneously the flow equations via the FEM equation solver, determining the three-dimensional temperature field and providing a more precise answer than the theory of composite soil layers.
Besides the general adiabatic boundary for the left and right shown by Equation 11, the FEMTherm model provided a choice named Fixedtemp that allowed users to preset the temperature on the vertical boundaries. Users were also able manually to define other important parameters, including the properties of pipe walls and soil, surface temperature of the soil, soil temperature at specified depth, ambient temperature, and heat transfer coefficient, allowing FEMTherm to predict the transient thermal behavior of the fluid and the surrounding soil under many circumstances.
Verification
Fig. 6 shows the pig position in the corresponding pipelines, with Pig 2 moving upon arrival of Pig 1. The arrival times for Pig 1 and Pig 2 are 8.3 hr and 27 hr, respectively. Fig. 7 shows the switching function of the valves, including calculated outlet flow rate with time for the preheated and the discharging pipelines. To be consistent with field operations, we modeled the pipelines as full of cool water before being preheated.
Before the arrival of Pig 1, the outlet flow rate of the discharging pipe (P-3) and the first preheated pipe (P-2) was roughly 250 cu m/hr, while that of P-5 was zero. Once Pig 1 was trapped at the last section of P-2, 8.3 hr later, the valve on the discharge pipe closed in accordance with Platform B starting to supply water at a flow rate of 100 cu m/hr, the outlet flow rate of P-3 and P-5 changing in opposite directions.
Figs. 8-9 show the simulated values for the inlet and outlet temperatures of the preheated pipelines. Outlet temperature increases sharply after the pigs arrive. After 13 hr and 36 hr of preheating, the maximum outlet temperature of P-2 and P-5 reached 63.2° C. and 58.5° C., respectively.
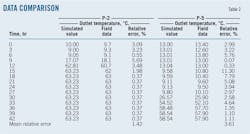
Table 2 compares field data with the simulated outlet temperatures. The percentage of mean relative error for the outlet temperatures of P-2 and P-5 is 1.42% and 3.61%, verifying the model's accuracy.
Parameter optimization
Water supplied by Platform B moved at a stable flow rate and temperature, while the preheating water from S-1 had an average temperature of 53° C. and flow rates as high as 350 cu m/hr. Two heaters on Platform A with a total power of 5,000 kw warmed the water. Subject to the rated thermal load of the heaters and the maximum flow rate, the preheating flow rate from Platform A could be 350 cu m/hr, 300 cu m/hr, 250 cu m/hr, 200 cu m/hr, and 150 cu m/hr, with corresponding temperatures of 65.2° C., 67.3° C., 70.1° C., 74.4° C., and 81.6° C. Comparing the preheating effects of different operational parameters allows for optimizing the preheating plan.
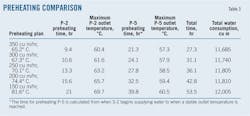
Fig. 10 shows the inlet and outlet temperatures of the preheated pipelines with time for the five operational parameters. Table 3 shows more detailed results.
The greatest difference in total water consumption in the five operational parameters is <320 cu m, with the maximum outlet temperature of P-5 remaining relatively steady. A better preheating effect was obtained at a higher flow rate of the preheating medium and a lower inlet temperature.
The flow rate of 350 cu m/hr combined with an inlet temperature of 65.2° C. took the least preheating time and used the least water. This preheating plan saved as much as 26.2 hr compared with the plan that used the highest inlet temperature. If crudes were input when the inlet temperature of preheating water at the onshore terminal reached a specified temperature, e.g., 40° C. or 50° C., the preheating plan with the highest flow rate at Platform A was still took less time than other preheating parameters combinations.
Acknowledgements
The authors thank CNOOC Research Institute for permitting use of Olga software, providing professional guidance, and providing field data. This work was also supported by the School of Petroleum and Natural Gas Engineering.
References
1. Gu, J., and Ma, G., "Determination of the Time for Oil on Buried Hot Oil Pipelines in the Course of Starting Transportation" (in Chinese), Journal of Liaoning University of Petroleum & Chemical Technology, Vol. 30, No. 2, pp. 29-31, February 2010.
2. Xing, X., Dou, D., and Li Y., "Optimizing Control Parameters for Crude Pipeline Preheating Through Numerical Simulation," Applied Thermal Engineering, Vol. 5, No. 1-2, pp. 890-898, March 2013.
3. Li, Y., Wu, C., and Yu, Y., "Parallel Computing on the Preheating and Commissioning of Hot Oil Pipelines," International Conference on Advanced Information Engineering and Education Science, Beijing, Dec. 19-20, 2013.
4. Vedeneev, D.E., "Combined Thermal-momentum Start-up in Long Pipes," International Journal of Heat and Mass Transfer, Vol. 33, No. 1, pp. 78-84, January 1990.
5. Li, C., and Zeng, Z., "Calculation of Heat Transmission of Buried Hot-Oil Pipeline at Starting" (in Chinese), Oil and Gas Storage and Transportation, Vol. 12, No. 4, pp. 38-41, July-August 1993.
6. Li, C., Luo, J., and Chen, Y., "Numerical Simulation of Heated Crude Oil Pipeline at Starting" (in Chinese), Oil and Gas Storage and Transportation, Vol. 21, No. 12, pp. 16-19, December 2002.
7. Yang X., "The Design and Management of Oil Pipeline" (in Chinese), China University of Petroleum Press, Dongying City, 2006.
8. Chen, C., "The Study on Heat Transfer of Pipelines During Start-up" (in Chinese), masters dissertation, Daqing Petroleum Institute, Daqing City, 2005.
9. Lu, Q., and Ma, G., "Influence of Hot Oil Pipeline Preheat Medium's Flowing Speed on Preheat Time" (in Chinese), Journal of Liaoning Shihua University, Vol. 31, No. 1, pp. 28-31, January 2011.
10. Han, X., "Calculation for Heat Transfer of Oil-water Mixture Preheating Process" (in Chinese), Journal of Petrochemical University, Vol. 26, No. 3, pp. 65-68, March 2013.
11. Svendsen, K., "Comparison of Models for Severe Slugging," Norwegian University of Science and Technology, Trondheim, 2002.
12. Mokhatab, S., and Towler, B.F., "Severe Slugging in Flexible Risers: Review of Experimental Investigations and OLGA Predictions," Petroleum Science and Technology, Vol. 25, No. 7, pp. 867-880, July 2007.
13. Omowunmi, S.C., Abdulssalam, M., Janssen, R., and Otigbah, P., "Methodology For Characterizing Slugs and Operational Mitigation Strategy Using Olga Slug Tracking Module - Egina Deepwater Project," Offshore Mediterranean Conference and Exhibition, Ravenna, Italy, Mar. 20-22, 2013.
14. Volk, M., "Displacement & Mixing in Subsea Jumpers-Experimental Data & CFD Simulations," Final Report of Research Partnership to Secure Energy for American, Apr. 22, 2013.
15. Xu, X., and Gong, J., "Pigging Simulation for Horizontal Gas-Condensate Pipelines with Low-liquid Loading," Journal of Petroleum Science and Engineering, Vol. 48, No. 3-4, pp. 272-280, March-April 2005.
16. Kinnari, K., Labes-Carrier, C., and Lunde, K., "Hydrate Plug Formation Prediction Tool - An Increasing Need for Flow Assurance in the Oil Industry," International Conference on Gas Hydrates, Vancouver, July 6-10, 2008.
17. Yu, B., Li, C., Zhang, Z., Liu, X., Zhang, J., Wei, J., Sun, S., and Huang, J., "Numerical Simulation of a Buried Hot Crude Oil Pipeline Under Normal Operation," Applied Thermal Engineering, Vol. 30, No. 17-18, pp. 2,670-2,679, December 2010.
18. Xu, C., Yu, B., Zhang, Z., Zhang, J., Wei, J., and Sun, S., "Numerical Simulation of a Buried Hot Crude Oil Pipeline During Shutdown. Petroleum Science, Vol. 7, No. 1, pp. 73-82, January 2010.
19. Yu, B., Wang, Y., Zhang, J., Liu, X., Zhang, Z., and Wang, K., "Thermal Impact of the Products Pipeline on the Crude Oil Pipeline Laid in One Ditch - The Effect of Pipeline Interval," International Journal of Heat and Mass Transfer, Vol. 51, Nos. 3-4, pp. 597-609, March-April 2008.
20. Zhu, H., Yang, X., Li, J., and Li, N., "Simulation Analysis of Thermal Influential Factors on Crude Oil Temperature When Double Pipelines are Laid in One Ditch," Advances in Engineering Software, Vol. 65, pp. 23-31, November 2013.
| . |
| FEMgrid automatically produces this grid distribution of the soil region surrounding the pipeline (Fig.4). |
| . |
| A magnification shows the soil-grid distribution mesh around the pipeline in greater detail (Fig.5). |
PREHEATING COMPARISON
Maximum Maximum
P-2 P-2 outlet P-5 P-5 outlet Total Total water
preheating temperature, preheating temperature, time, consumption,
Preheating plan time, hr °C. time, hr* °C. hr cu m
350 cu m/hr,
65.2° C. 9.4 60.4 21.3 57.3 27.3 11,685
300 cu m/hr,
67.3° C. 10.6 61.6 24.1 57.9 31.1 11,740
250 cu m/hr,
70.1° C. 13.3 63.2 27.8 58.5 36.1 11,805
200 cu m/hr,
74.4° C. 15.6 65.7 32.5 59.4 42.8 11,810
150 cu m/hr,
81.6° C. 21 69.7 39.8 60.5 53.5 12,005
*The time for preheating P-5 is calculated from when S-2 begins supplying water to when a stable outlet temperature is reached.
Table 3
The authors
Zongming Yuan ([email protected]) is a professor at Southwest Petroleum University, Chengdu, China. He has served as professor assistant, lecturer, and associate professor at the university since 1978. He holds a PhD (2003) in storage and transportation engineering of oil and natural gas from Southwest Petroleum University.
Yong Wang ([email protected]) is a PhD candidate at Southwest Petroleum University. He obtained his BS (2010) in oil and gas storage and transportation engineering from Xi'an Petroleum University, China, and now researches subsea pipelines.
Ying Xie ([email protected]) is an associate professor at Southwest Petroleum University. She previously served as a professor assistant and lecturer at the university since 1998 and holds an MS (1997) in oil and gas storage and transportation engineering from the school.
Kemin Dai ([email protected]) is an assistant engineer at China Petroleum Engineering Co. Ltd. Southwest Co., Chengdu. He holds a BS (2010) and MS (2013) in storage and transportation engineering of oil and natural gas from Southwest Petroleum University.
Liang Ming ([email protected]) is an assistant engineer at China Petroleum Engineering Co. Ltd. Southwest Co., Chengdu. He holds an MS (2013) in storage and transportation engineering of oil and natural gas from Southwest Petroleum University.
More Oil & Gas Journal Current Issue Articles
More Oil & Gas Journal Archives Issue Articles
View Oil and Gas Articles on PennEnergy.com


