US CCUS requires tens of thousands of miles of new pipeline
To achieve widespread deployment of carbon capture, utilization, and storage (CCUS), the US would need tens of thousands of additional miles of CO2 pipeline.1-3
In 2021, carbon dioxide (CO2) reached a record-high concentration in the Earth’s atmosphere for the modern era, and the concentration continued to increase in first-half 2023. The average 2021 concentration was 12.4% higher than in 2000.
Background
From 1991 to 2005, Northeast Energy Associates operated a natural gas-fired powerplant with carbon capture in Bellingham, Mass. Captured CO2 was used in the food and beverage industry.
Saskatchewan Power Corp.’s Boundary Dam Power Station in Saskatchewan, Canada, was the first coal-fired powerplant to implement carbon capture successfully. Operational since 2014, it can capture as much as 1 million tonnes/year (tpy) of CO2 for enhanced oil recovery and geologic storage.
NRG Energy Inc. placed the Petra Nova project in Thompson, Tex., into service in 2017. It was designed to capture at least 90% of the CO2 emissions from a 240-Mw equivalent flue-gas slipstream at the W.A. Parish Electric Generating Station and to store up to 1.4 million tpy of CO2. Captured CO2 was compressed and transported through an 80-mile pipeline for enhanced oil recovery (EOR).
The project paused operations in May 2020 due to a combination of low oil prices and mechanical problems. In 2022 it was acquired in-full by JX Nippon Oil & Gas Exploration Corp., which already owned a 50% share and plans a 2023 restart.
According to Global CCS Institute, there were no commercial cement manufacturing sites integrated with carbon capture and storage (CCS) as of 2021. Since 2015, however, Carbonfree Chemicals has been operating a pilot-scale demonstration at a cement manufacturing plant in San Antonio, Tex. The company uses captured CO2 to manufacture products such as baking soda, bleach, and hydrochloric acid. The technology can capture 75,000 tpy of CO2 from the plant, which reported around 500,000 tonnes of CO2 emissions in 2020.
In December 2020, HeidelbergCement AG announced its plan to install full-scale carbon capture at its Norcem cement manufacturing site in Brevik, Norway. CO2 capture is expected to begin in 2024 at a rate as high as 400,000 tpy. Captured CO2 will be transported by ship for temporary storage and then by the Northern Lights pipeline system to a subsea formation in the North Sea 1,000-2,000 m below the seabed. A CCS joint venture between Equinor ASA, Shell PLC, and TotalEnergies SE, Northern Lights’ first phase is due to be completed mid-2024 with the capacity to permanently store as much as 1.5 million tpy of CO2, expandable to more than 5 million tpy in a second development phase (OGJ Online, June 22, 2022).
Pipelines
Fig. 2 shows the current locations of CO2 pipelines in the US and example estimates of future pipeline needs. CCUS scale-up would require an increase in capture, pipeline, and storage infrastructure, each of which can take years to develop.
Several intertwining difficulties can affect cost and feasibility of this scale-up, including timing, negotiating with landowners for access, and the proximity of capture and storage sites. Even with these potential problems, pipelines are the most common and least expensive way to transport large volumes of CO2. Transporting CO2 by truck, rail, or ship may be viable for small volumes or short distances, but moving large volumes of CO2 by truck or rail is not economical. Most current infrastructure supports EOR using CO2 from underground, not from carbon capture.
As of 2020, the US had more than 5,000 miles of CO2 pipeline, according to the most recent data from the US Pipeline and Hazardous Materials Safety Administration (PHMSA). Although these pipelines are a mature technology and have been used safely at a commercial scale in the US since 1972, a recent accident prompted PHMSA to announce new measures to strengthen its safety oversight of CO2 pipelines.4
On Feb. 22, 2020, Denbury Inc.’s 24-in. OD Delhi pipeline ruptured, releasing liquid CO2 that immediately began to vaporize at atmospheric conditions. The site of the rupture was about 1 mile southeast of Satartia, Miss. Following the incident, PHMSA’s Accident Investigation Division and Southwest Regional Office investigated.
Carbon dioxide vapor is 1.53 times heavier than air, and displaces oxygen, so it can act as an asphyxiant to humans and animals. The weather conditions and unique topography of the accident site prevented the CO2 vapor from rapidly dispersing and allowed a plume to form that migrated toward Satartia.
Upon learning of the pipeline rupture, Yazoo County Office of Emergency Management shut down the nearby highway to all traffic and evacuated the area. Local authorities evacuated about 200 people near the rupture, including the entire town of Satartia (around 50 residents), and three homes across the Yazoo River. According to Denbury’s PHMSA F 7000.1 accident report, 45 people sought medical attention at local hospitals, including individuals who were caught in the vapor cloud while driving a vehicle. One individual was admitted to the hospital for reasons unrelated to the pipeline failure. There were no fatalities.
The pipeline failed on a steep embankment adjacent to the highway, which had recently subsided. Heavy rains are believed to have led to a landslide, which created axial strain on the pipeline and resulted in a full circumferential girth weld failure. After the accident, Denbury, under PHMSA’s oversight, cut out the failed sections of pipe and sent them to Det Norske Veritas (DNV) GL’s Columbus, Ohio, laboratory for metallurgical analysis. DNV confirmed the initial onsite observations of a girth weld failure.
PHMSA’s investigation also revealed several contributing factors to the accident, including Denbury not addressing the risks of geohazards in its plans and procedures, underestimating the potential affected areas that could be impacted by a release in its CO2 dispersion model, and not notifying local responders to advise them of a potential failure.
CO2 pipeline transportation costs will generally decrease as the capacity of the pipeline increases. CO2 pipeline infrastructure can take years to develop. States regulate the siting of pipelines on nonfederal lands, and their requirements for siting approval vary. When a proposed CO2 pipeline crosses federal land, it triggers a National Environmental Policy Act (NEPA) review, which prolongs the development process. But on Feb. 16, 2022, the Council on Environmental Quality issued interim guidance encouraging agencies to facilitate efficient, orderly, and responsible deployment of CCUS projects, including developing programmatic reviews under NEPA.5
Storage
The US has abundant potential geologic storage opportunities for CO2, but in some regions this storage may not be practical to develop for various reasons, including technical limitations and lack of economic viability. Developing storage can take several years and millions of dollars per site. Saline formations account for more than 95% of potential storage, according to DOE. Depleted oil and gas reservoirs are less abundant but are already well understood. Other geologic options such as shales, coal beds, and basalts may offer additional opportunities but have not been extensively developed.
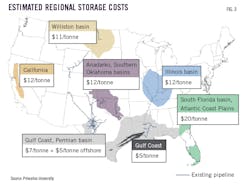
The International Energy Agency (IEA) estimates that more than half of onshore storage in the US costs less than $10/tonne of CO2, but storage costs can vary significantly (Fig. 3). Cost depends on the location and characteristics of each storage site, including the number of wells needed, the depth of the underground formation, and what the land around the site is already used for.
Projects seeking to inject CO2 into formations for permanent storage are subject to the Environmental Protection Agency’s (EPA) Class VI Rule and must obtain a Class VI permit, which governs injection of CO2 into deep rock formations for long-term storage. Although some CCS proponents expressed concern over the time it took past developers to receive a Class VI permit, others said timelines will improve now that the Infrastructure Investment and Jobs Act has authorized additional funding for EPA permitting of Class VI wells and a grant program for state enforcement.6
As of 2022, EPA had issued permits for two active Class VI wells, which took at least 3 years per permit. Interest in permits has increased, with 25 permit applications pending as of August 2022, and EPA officials said they are streamlining the permitting process. While there are many factors that influence permitting timeframes, EPA officials anticipate that prospective owners or operators submitting complete Class VI applications will be issued permits in roughly 2 years.
States may apply for primary enforcement authority, or primacy, for the Class VI well program. North Dakota and Wyoming have primacy for Class VI wells as of August 2022. After being granted primacy in 2018, North Dakota issued two Class VI permits, which took less than 1 year each. It remains unclear, however, whether Class VI primacy could expedite the permitting process more generally.
Timing
Developing the necessary infrastructure presents a chicken-and-egg problem: CO2-emitting industries hesitate to deploy capture technologies if there is no infrastructure to transport and store the captured CO2, but development of such infrastructure is risky if industry is not already capturing CO2.
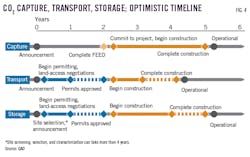
It can take years to plan, permit, and build infrastructure for capturing, transporting, and storing CO2 (Fig. 4). Developing this infrastructure in parallel rather than in sequence could accelerate deployment of the CCUS industry as a whole.
Private land access
Generally, developers must negotiate land access for both transportation and storage infrastructure, which can be costly. Transport and storage developers may have to negotiate with hundreds to thousands of landowners, depending on location and the distance between the capture and storage sites. These negotiations can be complicated for storage developers in states that have not explicitly defined who owns the underground pore space where CO2 is injected. Most states do not have a regulatory framework for geologic CO2 storage.7 Fewer than half have defined pore-space rights. Furthermore, only a few allow unitization for CO2 storage, a process that allows operators to proceed with injection after reaching agreement with a minimum percentage of owners, rather than all landowners.
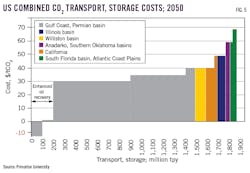
The distance between capture and storage sites affects the cost and feasibility of transporting CO2. Transportation costs are lower when capture sites are co-located with storage. The majority of point-source emitters in the US are within 30 miles of a potential geologic storage site according to IEA; but not every potential site will be technically or commercially feasible. In such cases, emitters may need to pay more to transport CO2 longer distances to storage sites that have already been established. A 2021 report estimated that with wider deployment, the majority of combined US transport and storage costs by 2050 could be $40 or less per ton of CO2, with an average cost of $17-23/tonne (Fig. 5).1
Shared infrastructure
CCUS pipeline networks are shared infrastructure that connect emitters that are geographically dispersed or far away from potential geologic storage sites. According to the IEA, 15% of point-source emissions in the US come from sources that are not near a potential geologic storage site. These emitters could reduce their CO2 transport costs by using networks of shared, larger pipelines (Fig. 6).
CCUS “hubs” are another example of shared infrastructure that connect the components of the CCUS industry (see box, p. 47). They allow emitters concentrated near potential geologic storage sites to participate in CCUS without needing to develop their own transport and storage infrastructure, while providing several sources of CO2 for transport and storage developers.
Economics
For emitting sites that could use point-source capture, deploying CCUS technology is an added cost to doing business that offers few opportunities to generate offsetting revenue. The commercial market for CO2 is small—for example, for enhanced oil recovery, fertilizer production, and the food and beverage industry—but there is growing interest in CO2 conversion.
Existing CCUS projects have largely been limited to sectors where the cost of capture was low and captured CO2 could be sold for use in EOR. All but one of the 12 operational CCUS projects in the US earn revenue from the sale of CO2 for EOR. But current demand is too small to incentivize more widespread deployment.
Direct air capture systems are not tied to a site that produces a conventional product, such as electricity or cement. Companies active in this nascent area are exploring possible revenue streams. These include selling CO2 removal as a service to businesses or individuals interested in offsetting their emissions, either directly or through voluntary carbon markets, or selling captured CO2 to utilization companies.
Similarly, there is little incentive to expand transportation and storage of CO2. Existing CO2 pipelines in the US were primarily built to transport CO2 for use in EOR; but the majority of this CO2 is extracted from underground rather than from carbon capture.
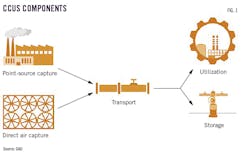
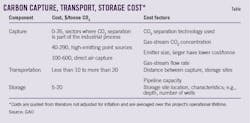
Storing CO2 does not generate revenue without financial drivers. The accompanying table summarizes the costs for carbon capture, transport, and storage per unit of CO2. For sectors where capture is costly (e.g., power generation, iron and steel manufacturing), the cost of capture is the dominant factor influencing the overall cost of CCUS. For sectors where capture is relatively inexpensive (e.g., bioethanol production), the costs of transport and storage are a greater consideration.
CCUS costs would likely decrease with more widespread deployment. The experience of implementing a technology at commercial scale under real-world conditions would help identify risks, optimize the system, and develop viable business models.
Community acceptance
Several factors influence community acceptance of CCUS projects and therefore will likely be important in determining the course of CCUS development and deployment. Generally, knowledge and awareness of CCUS can help communities make informed decisions about projects, but recent studies show that the majority of Americans are unfamiliar with CCUS.8
Successful deployment would require developers, policymakers, or other organizations to provide information to communities as projects develop. Such efforts benefit from careful planning and execution, without which the information provided can be inconsistent or overly technical. This can lead to misconceptions about or opposition to projects. Even good information does not always increase support. Rather, some communities may oppose CCUS more after certain information is provided. Near-term public opinion polling in regions of interest for CCUS development could help gauge local priorities and concerns.
Perceived risks, benefits
Communities are more likely to support CCUS projects when developers provide clear and realistic descriptions of the potential risks and benefits of the projects. Individual communities and groups within the community will perceive the potential effects of CCUS differently. Developers and outreach coordinators may be better able to engage with communities if they understand how each community views the potential risks and benefits of CCUS. For example, studies show that people often consider perceived benefits (or perceived lack of benefits) to be more important than perceived risks when forming an opinion of CCUS.9
In particular, communities may perceive local job creation, economic development, regional revitalization, and climate-change mitigation as potential benefits of CCUS. Perceived risks may include CO2 leaks, safety risks, and environmental damage.
Prior projects suggest that a community’s level of trust that developers and regulators will be honest, fair, and accountable may be more important than understanding technical information about a project. Further, information is more likely to be perceived as trustworthy and objective when it is endorsed by multiple sources. Project developers are perceived as less trustworthy when they are not transparent about decision-making, intentions, and local risks. Trust can be difficult to rebuild after negative experiences between communities and CCUS project developers, or between communities and other related industries.
References
- Larson, E., Greig, C., Jenkins, J., Mayfield, E., Pascale, A., Zhang, C., Drossman, J., Williams, R., Pacala, S., Socolow, R., Baik, E.J., Birdsey, R., Duke, R., Jones, R., Haley, B., Leslie, E., Paustian, K., and Swan, A., “Net-Zero America: Potential Pathways, Infrastructure, and Impacts, Final Report,” Princeton University, Oct. 29, 2021.
- Great Plains Institute, “Transport Infrastructure for Carbon Capture and Storage,” June 2020.
- DOE, “Carbon Capture, Transport, & Storage—Supply Chain Deep Dive Assessment,” Feb. 24, 2022.
- PHMSA, “Failure Investigation Report – Denbury Gulf Coast Pipelines LLC Pipeline Rupture/Natural Force Damage,” May 26, 2022.
- Carbon Capture, Utilization, and Sequestration Guidance,” 87 Fed. Reg., 8808, Feb. 16, 2022.
- “Infrastructure Investment and Jobs Act,” Pub. L. No. 117-58 § 40306, 135 Stat. 429, 1002, 2021.
- Gresham, R.L. and Anderson, O.L., “Legal and Commercial Models for Pore-Space Access and Use for Geologic CO2 Sequestration,” University of Pittsburgh Law Review, Vol. 72, 2011; Gray, T., “A 2015 Analysis and Update on US Pore Space Law – The Necessity of Proceeding Cautiously with Respect to the ‘Stick’ Known as Pore Space,” Oil and Gas, Natural Resources, and Energy Journal, Vol. 277, 2015; and Global CCS Institute, “Brief – Pore Space Rights – US Overview,” May 2022.
- Pianta, S., Rinscheid, A., and Weber, E.U., “Carbon Capture and Storage in the United States: Perceptions, Preferences, and Lessons for Policy,” Energy Policy, Vol. 151, 2021; Whitmarsh, L., Xenias, D., and Jones, C.R., “Framing Effects on Public Support for Carbon Capture and Storage,” Palgrave Communications, Vol. 5, 2019.
- Tcvetkov, P., Cherepovitsyn, A., and Fedoseev, S.,“Public perception of carbon capture and storage,” Heliyon, Dec, 5, 2019; Leiss, W. and Larkin, P., “Risk communication and public engagement in CCS projects: the foundations of public acceptability,” International Journal of Risk Assessment and Management, Vol. 22, 2019, pp 384-403.
