Growing US shale production reshaping global LNG market
Matthew Hong
Morningstar Inc.
Chicago
The US gas market is undergoing a structural shift that threatens to shake the established global LNG order. In 2017 the US became a net exporter of natural gas for the first time in 60 years. Driven by a combination of increased shipments to Mexico, and growing throughput at the Sabine Pass LNG export terminal, net exports averaged around 0.4 bcfd in 2017, compared to 1.8 bcfd net inflows in 2016.
Growing shale production underpins the market shift. In addition to fueling exports, the supply abundance is altering the landscape of domestic demand through an expansion in natural gas electricity generation and industrial use.
Short term, the abundant supply has weighed heavily on Henry Hub prices, and the incremental export demand has done little to change this. And medium-term prospects for significant LNG export demand come on the heels of a 5-year expansion in domestic natural gas generation capacity. This article details how the coming combination of domestic and export demand will inject much needed bullishness into the market.
US shale
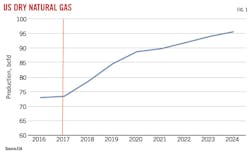
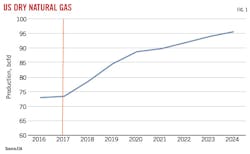
The advent of shale has seen US dry gas production grow at a meteoric pace to 73.3 bcfd in 2017 from 58 bcfd in 2010. Output is expected to reach 82.8 bcfd by 2019 according to the US Energy Information Agency (EIA). Production growth is expected to accelerate through 2020 before slowing, averaging 3% over the next 7 years (Fig. 1). Longer term EIA forecasts see production reaching 95.5 bcfd by 2024.
The regions that will drive gas production growth are the East, Southwest, and Gulf Coast, which coincide with the location of future US LNG projects. On a regional basis, the EIA forecasts Gulf Coast dry natural gas production to grow 13% in 2018 to 16 bcfd from 14.1 bcfd in 2017 and by another 24% to 19.8 bcf/d in 2024. The Southwest, which includes West Texas is expected to increase 5% in 2018 to 10.94 bcfd and by a further 13% to 12.4 bcfd in 2024. Eastern dry gas production is expected to grow 5% in 2018 to 23.5 bcfd from 22.4 bcfd in 2017 and by a whopping 58% to 35.6 bcfd in 2024.
The supply growth from these regions will be sustained by new demand from exports in the form of LNG and pipeline shipments to Mexico, as well as an increase in domestic demand from power generation.
Mexican exports
Mexican natural gas production is on the decline. Mexican gas reserves, according to the International Energy Agency (IEA), are 68% associated gas and 32% non-associated gas. Access to low cost US production and low oil prices have impacted development in conventional natural fields, leading to the decline in production. At the same time, reforms to the country’s power sector to reduce emissions have led to a replacement of oil-fired generation with natural gas-fired generation, pushing up demand for natural gas. These factors have combined to open the way for US supplies.
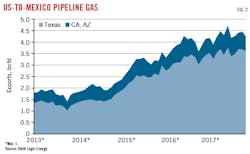
Pipeline exports to Mexico have grown over the past 2 years to 4.2 bcfd in January 2018 from 3.2 bcfd in January 2016 (Fig. 2). Although less significant, LNG exports to Mexico also jumped over 400% to 0.38 bcfd in 2017 from 0.07 bcfd in 2016.
As Mexico’s energy-market reforms progress, total exports to Mexico should remain strong. According to the country’s Ministry of Energy (SENER), total import demand for natural gas is expected to grow to 6.0 bcfd in 2020 from 4.8 bcfd in 2017, before flattening out to 5.7 bcfd between 2021 and 2025. While energy market reforms are set to encourage increased domestic production over the next decade, Mexico still needs to import more gas to meet demand in the meantime.
Meeting Mexico’s additional import demand is contingent on LNG shipments to by-pass pipeline congestion. The roughly 7.8 bcfd of pipeline export capacity between the US and Mexico is sufficient to meet demand. The current constraint is not cross border capacity but rather delays in building downstream connections to new gas-powered generation and industrial demand within Mexico. These delays lie behind the increase in Mexico’s LNG imports that have benefitted US shippers in the short term but are not expected to last.
LNG shift
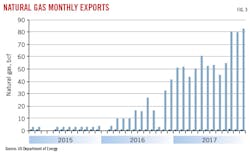
Over the past 3 years, US LNG exports have grown substantially (Fig. 3). Historically, the nation imported both pipeline gas from Canada and LNG from waterborne suppliers. Sabine Pass’s first liquefaction train entered operation in February 2016 and exports have grown rapidly since, to 706 bcf in 2017 from 28 bcf in 2015, with December 2017 posting a record monthly outflow of 82.4 bcf.
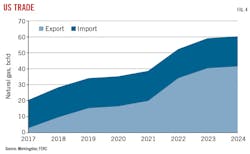
Sabine Pass exports have excited a domestic market otherwise mired in a low-price environment in which Henry Hub futures struggle to even provide a forward risk premium. With Sabine Pass up and running and six more terminals under construction, an additional 18 projects await US Federal Energy Regulatory Commission (FERC) approval or final investment decision. If all these projects came to fruition, there would be 42 bcfd in export capacity by 2024 (Fig. 4). A majority of this capacity will be in the Gulf, which could rise to 30 bcfd of export capacity according to FERC data. East coast projects would have 1.3 bcfd and the West Coast 1.08 bcfd.
With these plants operating at 90% capacity, the US could provide the world with 282 million tonnes/year (mtpy). To offer some perspective, total seaborne volumes of LNG in 2016 reached 258 mtpy, and 2017 volumes came in at 293 mtpy, a 13% increase.
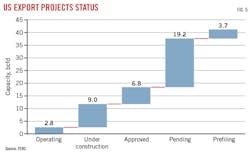
Announcing an export project doesn’t mean it will make it to commercial operation. Fig. 5 shows capacity in the project queue. Those operating or under construction represent 11.8 bcfd, or 80 mtpy of supply at 90% capacity, between 2018 and Q4 2019. These projects are Cameron LNG (2019), Corpus Christi (Q1 2019-Q2 2019), Cove Point (Q1 2018), Elba Island (2H 2018-1H 2019), Sabine Pass (Q4 2017-Q4 2019) and Freeport LNG (Q3 2018-Q3 2019).
The remaining approved, pending and pre-filing projects represent 30 bcfd between them. But significant headwinds exist for these projects, including those already granted regulatory approval by FERC and the US Department of Energy (DOE). Most projects with regulatory approvals in place await final investment decisions (FID). The FIDs typically require firm long-term shipper commitments. Low commodity prices have put pressure on counterparties willingness to provide 20-year firm commitments.
Whether all these projects see commercial operation is hard to ascertain but if we assume half of these projects come through, the US could be sending an additional 15 bcfd (100 mtpy) of LNG to the international market by 2024.
Global demand
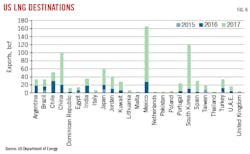
While Mexico was the top consumer of US LNG exports in 2017, a look at destination markets over the past 3 years reveals an unexpected Asian appetite for US gas (Fig. 6). US LNG exports grew to 1.7 bcfd in 2017 from 0.5 bcf/d in 2016. Mexico, South Korea, and China accounted for 53% of exports in 2017 with only 10% ending up in Europe. In 2016 these three countries accounted for 31% of US LNG exports, with Europe taking 3.5%. That pattern contradicted the assumption that Europe would take a larger share of initial exports, due to shorter distance and lower shipping costs. The existing infrastructure and maturity of the European market added to its expected appeal. However, total exports going to Europe were 30 bcf lower than volumes shipped to China.
Asian appetite
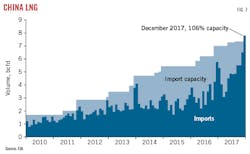
Asia’s appetite for LNG is evidenced by China’s ascendance to the world’s number two importer, surpassing South Korea but still well behind Japan. According to Chinese statistics, the country imported an average 5.0 bcfd in 2017 (Fig. 7), with demand from the industrial and residential-commercial sectors driving the growth while Japan imported more than double that volume with 11 bcfd in 2017. China’s drive to reduce pollution, a lack of storage capacity (3% of consumption), and shortages in pipeline imports, helped catapult LNG imports in 2017, during which LNG accounted for almost half of natural gas imports.
According to the EIA, China’s demand is expected to grow 39 bcfd by 2040, a portion of which will be fulfilled through importing additional LNG. As China addresses concerns with air quality and transitions the residential and industrial sector away from coal and toward natural gas additional natural gas demand is expected. China’s LNG imports could grow to 9.7 bcfd by 2024.
Contracts like Cheniere Energy’s purchase and sale agreement with China National Petroleum Co. (CNPC) are likely the first in what could be a string of Chinese buyers of US LNG. Not only is the contract term of this deal through 2043, but Henry Hub prices are used as the index, reaffirming the Chinese government’s long-term commitment to natural gas.
Demand from Japan and South Korea is expected to remain strong, with Japanese demand hinging on the restart of nuclear plants shut down since the Fukushima Daiichi accident. Once the nuclear fleet restarts, LNG demand from Japan should fall. Questions persist, however, with only a handful of nuclear plants having received clearance under new government safety standards.
South Korean LNG demand will continue to grow as the country reassesses the future roles of coal and nuclear plants that currently account for 71% of its electricity generation. The administration of President Moon Jae-in has made protecting the environment a core focus for the country’s energy policy. The desire to retire coal and nuclear generators while installing additional renewable assets will require more natural gas to ensure electricity reliability. Access to lower cost natural gas from the US will encourage greater commitment in US-based infrastructure projects, providing additional opportunities for US market participants.
European retirements
The power sector will drive LNG demand in Europe, as natural gas generation replaces retiring coal and nuclear plants. This trend, together with declining European natural gas production, will drive growth in both pipeline and LNG imports. Some forecasts expect European LNG imports to increase by 7% annually through 2020 and 4% a year from 2021 to 2025. High-demand winters could provide additional price incentives to redirect vessels to Europe from the US, or vice versa, as markets see greater interconnection. Cove Point LNG may be the plant best positioned to meet this growing demand, but Northeast winters could just as easily force pipeline reversals to domestic end users, forcing European counterparties to find alternative supply.
Seaborne market
As the global seaborne market for LNG develops changes will need to occur to ensure greater transparency and liquidity. About 71% of LNG export shipments continue to occur under the terms of long-term offtake agreements. Most contracts lack destination flexibility, restricting traders from taking vessels to higher price markets. Significant changes have occurred over the past year and a half—the development of liquid futures contracts and greater price transparency through gas-based instruments—but the market lacks a standard contract. Changes to short-term liquidity and a general standardization in operations will improve transparency.
As energy consumption patterns change in Organization for Economic Cooperation and Development (OECD) countries, and economic development drives greater demand in non-OECD countries, long-term demand for LNG appears structurally assured. The US is poised to supply large volumes to the seaborne market. With greater access to low-cost supply and additional export capacity projects expected, the future for US LNG is bullish. Additional demand from inelastic domestic end-users, however, will place short-term strains on the domestic system, potentially creating unwanted price volatility both at home and abroad.
Battle for supply
With export capacity expected to reach 11.8 bcfd by 2020, the major question is whether US supply can keep pace with demand growth from both export and domestic sectors, especially if working natural gas in inventory continues to fall below historic averages.
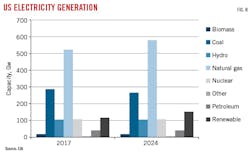
As the landscape for LNG exports evolves and the role the US plays in supplying seaborne demand changes, domestic producers will have to juggle their priorities between the attractions of overseas markets and the evolving domestic power sector. According to the EIA, the US had 1,184 Gw of operating electricity capacity in 2017 (Fig. 8). Factoring in retirements and new additions through 2024, the country is expected to add 73 Gw of capacity, or 6%.
Looking at expected changes to generation, three themes emerge:
• Coal’s decline continues. Installed coal capacity over the next 6 years will decline 7% to 264,421 Mw.
• Renewable generation grows31% over the same period, with more wind projects slated for development than solar. By 2024, the US could have 109,951 Mw of installed wind and 37,097 Mw of installed solar.
• Natural gas generation grows 11% by 2024. If all planned plants are brought online an additional 57,837 Mw of natural gas generation capacity could be created, equating to between 3.2 and 8.6 bcfd in incremental demand between 2017 and 2024 (see accompanying table). This range represents the two extremes of efficiency (heat rate) and plant use (capacity factor).
The EIA’s Annual Energy Outlook for 2018 forecast a 2.0 bcfd growth over the same period. The likely outcome will be 2.0-3.2 bcfd of additional utility demand. Greater penetration of renewable generation across most of the country ultimately caps natural gas generation, although regional seasonality and fuel mixes create variations.
EIA also expects demand to expand in the residential-commercial and industrial sectors, forecasting an additional 2.9 bcfd of industrial demand and 0.75 bcfd of residential-commercial demand by 2024. As economic growth continues domestically, and industrial users convert older inefficient boilers to more efficient natural gas boilers, demand from the sector should remain strong. Growth in these two sectors is primarily driven by expansion in three EIA census regions: the West South Central (WSC), Middle Atlantic, and South Atlantic.
Regional conflict
Given the expected growth profile in domestic natural gas demand there are two regions in which we expect gas-on-gas competition to surface: the Northeast and Gulf-Southwest. It is not a coincidence that these two regions are also production centers, their prolific output and low prices having encouraged development of local and export demand.
Including the 0.86 bcfd of liquefaction demand at Cove Point, the Northeast region could see an additional 3.12 bcfd of incremental natural gas demand over the next 4 years. Northeastern dry production, which includes the Marcellus-Utica shale, is expected to grow to 32.8 bcfd in 2022 from 23.5 bcfd in 2018. Supplies from this region meet demand not only in states nearby, but also get sent to New England, the Midwest, and south toward the Gulf.
Current supplies easily exceed local demand from electric power providers (EPP, 2.3 bcfd) and Cove Point exports. But as more of this supply moves out of the region, it begins to be stretched thin. Infrastructure (or lack of it) plays a part in this picture by constraining supplies leaving the Northeast.
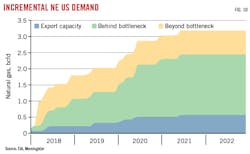
Fig. 9 shows how natural gas demand from the electricity sector is expected to grow in areas upstream and downstream of transportation constraints. Data show three demand centers: supply rich states Pennsylvania, Ohio, and West Virginia (upstream), the states further north—New York and Massachusetts—(downstream), and Cove Point export capacity. When heating demand increases during the winter, the states downstream of the constraint struggle to secure supplies, causing prices to spike.
Using a 7.3 heat rate and a 56% capacity factor, Ohio, West Virginia, and Pennsylvania could register 1.8 bcfd of additional electricity demand for natural gas by 2022 and states further north could experience an additional 0.5 bcfd of utility demand. Inadequate takeaway capacity means the additional 0.5 bcfd of demand beyond the constraint will require adjustments by grid operators and other market participants.
Environmental protests are slowing pipeline projects designed to relieve this congestion.
This dynamic moved front and center this past winter. When temperatures hit seasonal lows in early January, regional transmission organization PJM Interconnection LLC, based in Norristown, Pa., relied on coal generation to meet demand. Coal generation’s share in January hit 35% before falling back to the 20%-25% range. In states further north, which typically do not rely as heavily on coal generation, oil plants ended up meeting peak demand.
LNG imports can help alleviate pipeline congestion into the Northeast, as demonstrated by imports from Trinidad and Tobago and Europe this winter. Independent Service Operator-New England’s (ISO-NE) Winter Reliability Program has offered generators incentives to build storage for and secure LNG supplies. US LNG delivered into points downstream of the transportation constraints will need to be delivered into Canada first and piped into the US due to Jones Act prohibitions against domestic shipments on foreign flag vessels and the absence of US-built LNG carriers.
The EPP sector in the Northeast relies heavily on traditional fuels to meet demand, and as coal and nuclear retirements continue, additional pressure will be put on natural gas plants to fill the void during periods of high seasonal demand. To the degree LNG can relieve the constraints on natural gas moving further north, Marcellus-Utica production can meet incremental local utility demand and potential growth in export demand on the US Gulf Coast, forcing domestic market participants to incorporate global fundamentals into their considerations.
Gulf Coast demand
The second region seeing significant demand growth is the US Gulf. Most of the announced LNG projects under construction or in post-FID status are there. Shipments from the Gulf will rely heavily on access to natural gas from Permian, Haynesville, and Eagle Ford shale resources as export volumes increase. And as efficiencies in oil drilling plateau, growth in associated natural gas from the Permian will slow, requiring Marcellus-Utica, Haynesville, and Eagle Ford supplies to pick up the slack.
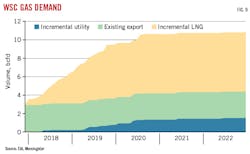
While Gulf Coast and Southwest production is expected to grow to 31.6 bcfd in 2022 from 26.9 bcfd in 2018, this falls short of the 7.8 bcfd (53 mpty) of liquefaction capacity coming online (Fig. 10). To meet this demand gas will need to be pulled from surrounding production regions, most likely the Marcellus-Utica basin and Midcontinent.
Outside of additional LNG demand, the grid dynamics in the WSC (Texas, Louisiana, Oklahoma, and Arkansas) are changing, most markedly for the Electric Reliability Council of Texas (ERCOT). The council’s capacity reserve and demand report from December 2017 projects adding 870 Mw of natural gas-powered generating capacity in 2018 to ERCOT’s existing 47,485 Mw fleet, growing to 51,517 Mw by 2024. These plants are categorized as likely to come online.
If these 4,032 Mw are the only projects to come online over the next 6 years, demand for natural gas in Texas would rise by 0.4 bcfd, assuming a 7.3 heat rate and a 56% capacity factor. Several additional projects, however, have been announced, totaling 12,750 Mw over the same period. Not all these projects will come online, but if they did, incremental natural gas demand would be 1.5 bcfd. Assuming a midpoint between the two estimates, Texas could reasonably see an additional 0.9 bcfd of EPP demand by 2024.
The largest share of incremental demand in the Gulf Coast region, however, will come from the export market. In 2022, incremental domestic demand in this part of the country could be 2.2 bcfd. Domestic demand plus the 7.8 bcfd from LNG exports and an additional 1.0 bcfd from Mexico pipeline exports could see 11 bcfd in incremental demand in 2022, exceeding incremental production of 4.6 bcfd and creating a regional imbalance of 6.4 bcfd.
The solution to meeting simultaneous incremental demand growth from the domestic and export sectors will be two pronged. The first lies in removing bottlenecks constraining shipment of Marcellus-Utica supply to the Gulf to meet demand for LNG.
The second will come from greater adoption of renewable generators. ERCOT is expected to add 1,963 Mw in 2018 to its wind fleet 20,201 Mw. By 2024, ERCOT expects 28,756 Mw of installed wind capacity. Over the next 6 years, wind additions will outpace natural gas additions by 2 to 1.
Renewables already accounted for 18% of state electricity generation in 2017. As the number of renewable projects expands, the demand put on EPPs to burn natural gas will flatten, allowing local supply to meet exports.
As LNG export projects come online on the US Gulf Coast, however, Texas basis prices may develop a stronger correlation with overseas markets, inserting a level of volatility that has been lacking at both Waha and Henry Hubs. Incremental utility growth will compete with more lucrative export opportunities, lifting prices in the process. As exports to Mexico via pipeline and the seaborne market grow, more expensive production will need to be brought in from outside the Gulf-Southwest supply basin to meet demand, assuming no other constraints exist. The only hope of relief for local EPPs will come with higher renewable penetration relieving the supply pressure by reducing demand for baseload natural gas in the long-term.
US LNG
The prospects for US LNG are structurally bullish as global demand grows. Growth in export capacity coupled with strong global demand from Asia and Europe give low-cost US shale producers a strategic advantage. The ability to transport natural gas domestically between regions, however, is a key variable in determining how the various sources of demand are met. As more natural gas consuming projects move to later stages of development while production starts to flatten, the US could find itself undersupplied.
As integration increases between US and international markets, domestic players will need to understand changing overseas fundamentals. Competition for supply between exporters and domestic users injects complexity into US regional fundamentals and could well pull prices higher.
The author
Matthew Hong ([email protected]) is director of research at Morningstar, Chicago. He has also served in several positions in trading and consulting. He holds a bachelor’s from Marquette University and a master’s in business from the University of Minnesota.
