Operating Eunice, La., demethanizer at high pressure yields unique data
El Paso Field Services Co.'s demethanizer at its Eunice, La., gas plant has operated consistently at pressures greater than 500 psig; this operation provides the industry a unique opportunity to collect real plant data for high-pressure demethanizers.
Experience and available data for cryogenic gas processing plants with demethanizers operating at greater than 500 psig have been limited in the gas processing industry. Gas Processors Association member companies want to improve cryogenic gas plant designs by reducing the required recompression horsepower.
Higher demethanizer operating pressures would allow an optimal recompression horsepower, which is normally required for increasing lean residue gas to pipeline pressures.
Industry experience with cryogenic demethanizer columns operating at 200-450 psig is widely recognized. Typical tray efficiencies for cryogenic demethanizers operating at 200-400 psig are reported in the literature.1
In many cases, operators do not consider demethanizer column designs greater than 500 psig because they approach the columns' critical pressures. In some cryogenic gas plant designs, the higher pressure demethanizer operation also allows one to process inlet feed with more CO2, without forming any CO2 solids in the demethanizer's cryogenic sections.
This article provides calculated tray efficiency data based on data collected for El Paso's high-pressure column. These data provide a reference point for future operations of this demethanizer and for high-pressure demethanizer designs with similar trays.
This article also discusses other points for the design of high-pressure demethanizers.
Although there are many advantages for operating a demethanizer in a high-pressure mode, there are also drawbacks that must be considered when designing a cryogenic gas plant.
Background
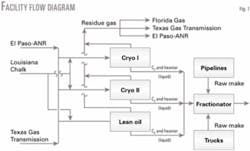
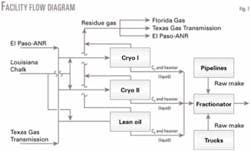
El Paso's large gas processing plant in Eunice, La., sits at the junction of the southern Louisiana pipeline systems of ANR Pipeline Co. (an El Paso subsidiary), Texas Gas Transmission LLC, Louisiana Chalk Gathering System, and Florida Gas Transmission Co.
null
The plant contains two cryogenic gas processing units—Cryo I and Cryo II—and a refrigerated lean oil plant to extract NGLs from the pipeline gas. The facility fractionates NGLs extracted from the gas processing units and third-party liquids into ethane, propane, butanes, and pentanes-heavier products.
The facility also has a centralized propane refrigeration system, cooling water, steam, and other essential utilities, as well as product treatment, storage, loading, and other infrastructure.
null
Demethanizer system
null
The 79-ft high column has three different sections: a 156-in. diameter top section, a 108-in. middle section, and a 72-in. bottom section.
The column contains 10 valve trays in the top section, 8 valve trays in the middle section, and 12 valve trays in the bottom section. Nutter Engineering (now Sulzer Chemtech Ltd.) supplied all the trays.
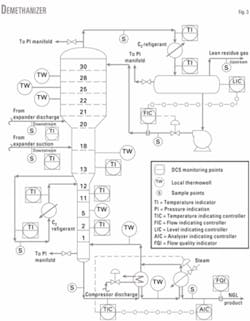
The column is designed for a pressure of 600 psig and normally operates at 500-550 psig. The column is equipped with instruments to measure temperatures and pressures in each section.
Unlike many cryogenic gas-plant demethanizers, the El Paso column was designed with a partial-reflux condenser, accumulator, and pumps to deliver reflux back to the column. The plant has a cascade ethane refrigeration system to partially condense the overhead and provide necessary reflux to the column.
The reflux system is flow controlled with continuous monitoring. The column overhead flows to the condenser, which has temperature-monitoring points at the inlet and outlet.
The column has a side reboiler to supply partial heat. It is integrated with the ethane refrigeration system to recover the cold refrigeration.
The side reboiler draws liquids from the bottom of Tray 13, which are heated and partially vaporized with warm ethane refrigerant and returned to the top of Tray 12. The side reboiler also has temperature-monitoring points on both sides to measure its performance properly.
The main reboiler is heated with warm recompressor discharge; a steam-heated trim reboiler supplements the heat requirements when necessary. The reboiler heat input is temperature controlled and adjusted based on the methane:ethane ratio in the bottom NGL product.
NGL product is analyzed and removed from the reboiler with continuous flow measurement. The main and trim reboiler systems have temperature-monitoring points and flow measurement for the steam supply.
The column is fed from two sources. The first is a low-pressure feed from the turboexpander discharge. The second feed is a high-pressure condensed liquid stream separated at the knockout drum upstream of the expander.
Both streams have temperature monitoring to the demethanizer. The flow and composition of the combined plant feed is continuously measured. The flow and composition of lean residue gas from the column reflux accumulator is also measured and analyzed at the warm side of the gas-gas exchanger.
This demethanizer system is well equipped to monitor and measure column performance and efficiency. The column's steady operation provided a good opportunity to measure tray efficiencies.
Preparation for performance testing
Test preparation is usually the most important phase for any performance test. We used a checklist published by Kister to guide our preparation for the performance test.2
We outlined and discussed a brief tentative plan based on the inputs received from various in-house and plant operation personnel. The most important parameters for the performance test are based on:
- Composition and flow rates for the inlet gas, lean residue gas, and demethanized NGL product, which allow an overall calculation of the material balance.
- Reflux flow rate.
- Flow (indirect or direct) and temperatures for heating steam to the column side and bottom reboilers to determine the heat input at each location.
- Temperatures in and out of the side and bottom reboilers for the column-side fluids.
- Flow of ethane refrigerant (indirect or direct) to the condenser.
- Temperatures on both sides of the overhead condenser.
- Temperatures of both column feeds and column overhead.
These parameters would allow us to calculate an overall heat and material balance for the column. Also, additional sample points (Fig. 3) for the column overhead to the condenser and reflux liquid provided additional data points. The column can also monitor certain temperatures on the column trays.
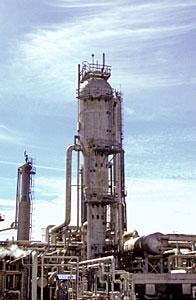
The high-pressure demethanizer at El Paso's Eunice, La., gas plant consistently operates at greater than 500 psig (Fig. 2).
Before the test, we reviewed the instruments with plant personnel to ensure that the flow measurements on the drawings were still in operation and properly calibrated.
Also, we prepared a list and marked drawings to ensure that all measurement points, including those recorded using hand-held monitoring devices, were accounted for.
Column testing
We conducted two separate tests on different days. At the beginning of each test run, a quick check ensured that the column had run steadily for several hours.
At the start of the first test, a preliminary heat and material balance determined if any additional data or adjustments in the data collection process were needed to help with the test analysis.
We checked the flow, pressure, and temperature measurements to ensure that the data were consistent with the overall heat and material balances.
Test results
The second test provided a better overall balance compared to the first test.
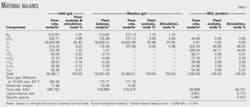
Table 1 shows the overall material balance for the second test.
The overall material balance compares simulation results and plant test data for compositions, overall mole balance, and liquid production. The balance is based on the measured inlet gas and NGL production data during the test.
The distributed control system log provided the total volumes processed during the test. Online gas and liquid analyses, and test samples validated the analyses for the inlet, residue, and product streams.
The overall material balance error was less than 1%. The error for individual compositions for the plant test data vs. the simulation results was less than 5%, except for the CO2.
The overall column simulation used feed flows, temperatures, and pressures measured during the test. Variations in feed temperatures during the test were less than 2° F. The pressures did not change significantly.
The simulation's reflux rate was the average reflux rate during the test. The reflux rate varied less than 6% during the test.
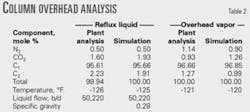
Table 2 compares column reflux analyses. The column overhead and reflux drum pressures were 540 psig and 535 psig, respectively.
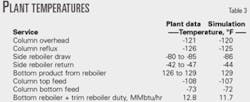
The energy balance for the side and bottom reboilers used recorded temperatures from both sides of the exchangers, as well as indirect calculations for the exchangers' heat input. The temperature on the column-side reboiler varied less than 5° F.
Calculated heat duty for the bottom reboiler (compressor discharge plus steam heat input) varied slightly more (9% maximum) than the side reboiler, most likely due to temperature variations in the compressor discharge and fluctuations in control valve adjustments. We adjusted the simulation to match the temperatures and duty to maintain the methane:ethane ratio in the bottom NGL product.
Table 3 shows various temperatures and reboiler heat duties.
The demethanizer bottom pressure was a constant 547 psig during the test. The reboiler temperature varied a few degrees due to the analyzer, which controlled the methane:ethane ratio in the bottom product.
We attempted to take spot samples of the side liquid draw and the column bottom liquids to the reboiler. This was difficult due to boiling liquids and the absence of a closed liquid-recirculation loop. The overall analysis was inconsistent due to spot sampling errors and was not reliable for matching the simulation.
We recorded additional temperatures on Trays 3, 11, and 13 and closely matched them to the simulation. The temperatures varied 3-6° F., with higher temperature differences in the bottom trays.
Tray efficiency simulation
We conducted a column simulation run using the test results and an initial guess of the tray efficiency, assuming that it is uniform within the top and bottom sections. The condenser, reboiler, and side reboiler were assigned one theoretical stage each.
Simulated column pressures, duties, tray temperatures, and product purities were matched with the test results as closely as possible by varying tray efficiencies in the column's top, middle, and bottom sections.
Product purity ratio and reflux rates were constant. The simulation used a Peng-Robinson, Lee-Kesler property package, which is reliable for light hydrocarbon systems.
After the simulation results and tray efficiencies in each section were closely matched to the tray temperatures, we examined the sensitivity of the side and bottom reboiler duties and product rates to tray efficiencies. This was one of the most critical steps in finalizing the tray efficiencies for each section.
After we finalized the tray efficiencies, we quickly checked the column tray loading for each section. The tray-loading calculations used property data from the simulator. Tray loadings were approximately 40% of jet flood in the bottom and 70% of jet flood in the top. Tray liquid loadings were approximately 68% in the bottom and 75% in the top.
Although the overall tray temperatures, heat duties, product rates, and purities were matched closely to the simulation, the product CO2 content did not closely match the test results. The simulation consistently underpredicted CO2 production compared to the plant test data.
Findings
Based on plant test data and simulation results for the high-pressure demethanizer running at approximately 550 psig, the tray efficiencies were about 24-25% in the top, 27-30% in the middle, and 34-35% in the bottom.
These results provide a reference point for future designs of high-pressure cryogenic demethanizer valve-tray efficiencies.
High-pressure demethanizers can extract NGLs based on a specific plant design—such as the availability of cold refrigeration, high inlet pressures, higher CO2 levels in the inlet feed, etc.—when it provides an economical advantage.
For high-pressure cryogenic demethanizer designs, one must consider:
- The plant's startup may have more steps if the process is integrated with an external refrigeration system.
- Different operating modes for the column reboiler system may require an additional heat source. This may require a trim reboiler to supplement the column reboiler.
- Additional safety considerations during the design, especially when the demethanizer is integrated with a cascade refrigeration system.
Acknowledgment
The authors thank the personnel at the Eunice gas plant for supporting this performance test and allowing us to collect and use the data.
References
1. "Engineering Data Book," 11th Ed., Gas Processors Suppliers Association, Tulsa, 1998.
2. Kister, H.Z., "Distillation Operation," McGraw-Hill Cos., New York,1989.
Based on a presentation to the 83rd Annual Convention of the Gas Processors Association, Mar. 14-17, 2004, New Orleans.
The authors
Kamal Shah is a technical vice-president for Aker Kvaerner ASA, Houston, and has been with the company for 17 years. Before that, he was a chief process engineer with Key Engineering Group Ltd. He holds a BS and MS in chemical engineering from Michigan State University.
Barry Stucky is a principal engineer for El Paso Field Services Co., Houston, a position he has held since January 2001. Before that, he was a facilities engineer for Coastal Field Services Co. Stucky holds a BS (1986) in petroleum engineering from the University of Kansas. He is a member of GPA.
