Geomorphic approach vital to design of pipelines crossing mountain streams
Flood discharge and stream scour studies at pipeline mountain stream crossings alone cannot adequately protect a pipeline where other, more-hazardous processes are possible.
Studies have shown that scour, impact, and aggradation associated with debris flows, outburst floods, or related phenomena may fundamentally change the parameters needed for proper pipeline crossing design. Depending on the process type, the peak discharge of the hazardous process can exceed that of the design flood (typically 50-200 year return period) by factors of 2 to 50.
Similarly, scour or aggradation by a nonfluvial process can exceed the hydrologically derived estimates by several factors. A geomorphic approach, therefore, should be taken to recognize and quantify the potential for nonfluvial processes. The findings must be integrated into the design of pipeline crossings.
For pipelines, streams present three basic crossing options: conventional burial, horizontal directional drill, or aerial. The choice of crossing method depends on costs, the dominant geomorphic processes at the stream crossing, and environmental constraints. Key design data for conventional crossings include estimates of scour and bank erosion for the design flood as well as the potential for channel degradation and avulsion.
Additional data required for aerial crossings include the peak discharge for the design flood and an estimate of the type of debris that will be transported during floods. This is to ensure that the infrastructure lies outside the debris impact zone.
Traditional flood-hazard assessment relies on frequency analysis of streamflow or regional rainfall intensity-duration data. Numerous forensic investigations note that other processes may dominate, particularly in smaller watersheds. These processes exceed the design flood with respect to discharge, impact forces, and sediment inundation.1
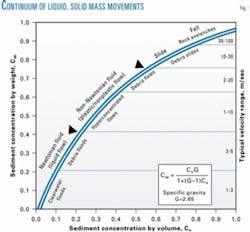
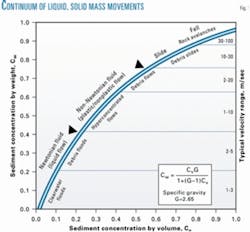
Examples include glacial outbreak floods, landslide dam outbreak floods, debris flows, hyperconcentrated floods, and lahars (volcanic debris flows). Similarly, debris slides and rock falls can transform into debris flows, hyperconcentrated flows, and finally clearwater flood flow (Fig. 1).2
Flow transformations can quickly change the character of the hazard from predominantly deposition and magnitude loss to one dominated by scour and magnitude increase. For example, the addition of streamflow from a tributary to a debris flow changes the water concentration and may abruptly increase the erosivity downstream of the confluence. Variability in channel gradient and channel confinement may lead to material entrainment in a debris flood that may then transition to a debris flow.
These processes can have long-lasting impacts on the safe and efficient operation of pipelines. Consequently, their recognition and characterization are extremely important in determining pipeline alignment and designing pipeline crossings.
Identification requires expert knowledge and a thorough geomorphic investigation of the watershed drained by the subject stream. Often, a hazardous process can begin many kilometers upstream of the pipeline crossing and, through a complex cascade of geomorphic events, lead to catastrophic discharge at the crossing.
Neglecting these hazardous processes may result in costly and repeated pipeline interruptions. Case studies from Bolivia and Canada illustrate the significance of geomorphic processes in mountain streams.
Rio Avispas, Bolivia
The Oleoducto Carrasco-Cochabamba pipeline (OCC) was constructed in 1998 to transport crude oil from Carrasco to Cochabamba, Bolivia. Rights to operate the pipeline were purchased by Transredes SA, but the pipeline has not yet been put into service.
A portion of the pipeline traverses the Sub-Andean Ranges geological region, an area consisting of weak sedimentary rocks that are prone to instability. Local rainfall can exceed 4,000 mm/year (160 in./year). There are a number of aerial crossings through this section, with the design span and pipeline clearances apparently based on conventional hydrological methods for predicting peak stream discharge.
In late February 2003, several stream crossings were severely damaged and required replacement. The authors found that one of the crossings was subject to a hyperconcentrated flood (possibly resulting from debris flows or a landslide dam failure several kilometers upstream), while two others were damaged by debris flows. Clearly, peak event discharge exceeded conventional flood discharge by at least one order of magnitude at each of the crossings.
The debris flow appears to have been triggered by a debris slide about 1-km upstream of the crossing. A large volume of debris was deposited at the crossing, which was about 50 m below the apex of the debris flow fan. The gully is rapidly down-cutting through this debris.
Several debris slide scars on the slopes upstream of the crossing, and the distribution of older boulder deposits, indicate that debris flows occur frequently and that larger magnitude events have occurred in the past.
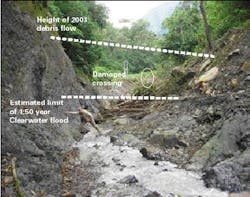
The headwaters of the Yana Mayu contain a large accumulation of rock fall and slide debris that is marginally stable. It appears that release of a small portion of this debris initiated the February 2003 debris flow (Fig. 2).
The debris flow traveled down an entrenched bedrock channel and damaged the pipeline crossing by undermining its foundations. Limits of the debris flow were identifiable based on the extent of moss and vegetation damage to the gully sidewalls.
*Zymoetz River, BC
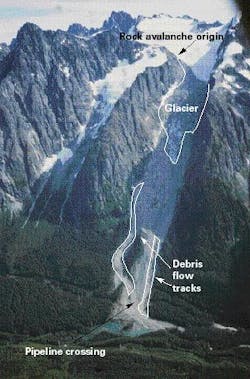
On June 8, 2002, the Pacific Northern Gas Pipeline (PNG) was severed by a rock avalanche that transformed into a debris flow at KM 15.5 on Copper River Road in western British Columbia.3 The rock avalanche originated in a bedrock cliff at 1,390 m elevation in a steep cirque basin (Fig. 3). About 1.4-million cu m of rock rushed down 600 m into the cirque basin where it transformed into a debris flow.
The debris flow was 100-120 m wide and moved through a narrow canyon 300-m long. Just before reaching the river, the pipeline was destroyed by the debris flow, which then spread onto the Zymoetz River floodplain and across the river over a distance of 250 m. A 10-20 m high dam formed and impounded a lake that extended 1.5 km upstream.
Loose material deposited along the channel from the initiation zone to the Zymoetz River may easily be entrained in future debris flows. Therefore, renewed debris flow activity can be expected and should be integrated into the planning of future permanent pipeline crossings.
This example shows the importance of the cascading effect of process transformation from a remote source. In the planning phase of pipelines, all possible processes should be investigated, sometimes several kilometers upstream of the pipeline to identify potential landslide processes that may transform and affect the crossing.
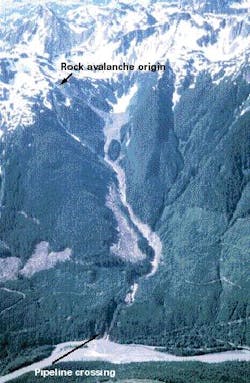
The PNG pipeline through Telkwa Pass, western British Columbia, was severed by a rock avalanche Sept. 11, 1999, that originated as a topple at 1,923 m elevation (Fig. 4). The 900,000 cu m rock avalanche traveled over a glacier and descended into Limonite Valley, a distance of 2,700 m, and dropped 1,300 m in elevation.3
A debris flow originated during or shortly after the rock avalanche. The pipeline was likely severed by the debris associated with the rock avalanche.
While little can be done to prevent rock avalanches or to protect pipelines from direct rock avalanche impacts, it is possible to identify areas where rock avalanches could originate. With continued climate warming and associated glacial retreat, additional, formerly glacially buttressed slopes will become susceptible to this process.
Rock avalanche runout can be estimated by a number of empirical and mechanistic models. In such estimating, the possibility of transformation into debris flows can be accounted for and stream crossings designed accordingly.
Donjek River, Yukon
A pipeline crossing the Donjek River in the Yukon originally was designed as a conventional open cut crossing. It was known that the river experienced glacial outburst flood events from time to time, and several investigators had studied the process.4 5
The estimated 100-year runoff flood peak was 1,400 cu m/sec at the crossing, but various computational (empirical) approaches developed by the investigators estimated burst outflow peaks from Lake Donjek at 2,270-13,000 cu m/sec. These outburst episodes appeared to have occurred frequently enough that risk of occurrence was considered necessary to pipeline crossing design.
The dilemma was in determining which of the outburst flood peak estimates was the correct one, and further, how much might a hydrograph attenuate within the downstream reach to the crossing site. This reach consists of a wide, shallow floodplain in which significant flood peak attenuation might be expected.
An assessment of the river survey data collected near the pipeline crossing resolved the situation. Most highwater marks during the survey were in the zone expected for runoff flood events.
A single exception was a water level very much higher than the rest, and this was assumed to have resulted largely from an outburst flood. The corresponding discharge which this highwater mark represented was estimated to be 3,500 cu m/sec. This flood peak was adopted as being a reasonable value for the design flood.
Standard estimates
Peak flow estimates for ungauged streams are commonly based on correlation with watershed area and precipitation.6 7 Peak flows are estimated using the rational formula, regional analysis, and the unit hydrograph methods for watersheds with fewer than 5 years of data, and frequency analysis for watersheds with more than 5 years of data.8 Criteria have been developed that allow the extension of recurrence intervals of gauged streams to avoid meaningless extrapolations (Table 1).
A systematic method to evaluate watersheds, with respect to geomorphic processes, can influence the frequency, peak flow, scour, and deposition of hazardous events related to stream channels.
Analysis, aerial photos
Historical analysis includes a complete search for information on past events from long-time residents, newspapers, government agencies, and owner records. A preliminary recurrence of hazardous events can be established and, if possible, stratified by type of event (floods vs. debris flows, outbreak floods, etc.). If this analysis is conducted over a wider region, it is important to recognize that historical accounts are strongly biased towards settled areas. Remote regions tend to be under-represented.
The interpretation of stereo aerial photographs provides a powerful means of identifying and characterizing potential rock avalanches, debris slides, and debris flows.9 The choice of aerial photographs depends on the size of the watershed or study area. Usually, examination of small scale (1:50,000) or medium-scale (1:30,000) photographs precedes examination of high-hazard sites on large-scale photographs (1:15,000 to 1:5,000). Aerial photographs indicate the following:
- Debris flows (boulder levees, scoured channels, confined debris lobes, avulsions in channel bends).
- Hyperconcentrated flows and lahars (vicinity to volcanoes and areas of fine, easily erodible sediments such as loess, distinct upstream point sources, destroyed vegetation along the flow path, expansive colluvial fans).
- Landslide outbreak floods (landslide deposits on both sides of the channel, scour marks downstream of the breach, unstable cliffs or hillslopes near the channel, expansive alluvial fans).
- Moraine dam-glacial lake outbreak floods (breached moraine dams, proglacial lakes, supraglacial lakes, scour and aggradation downstream, retreating glaciers).
These indicate past events or the potential for future events and lead to the prioritization of sites for follow-up field investigations.
Total volume analysis
A significant body of research exists on watershed characteristics correlated with debris flow volume and peak discharge.10-12 Most authors correlate debris flow volume with either basin area (AB) or channel length (LC), but this approach oversimplifies the problem.
Multivariate approaches—including variables describing basin geometry and ruggedness as well as the geotechnical properties of the materials—provide accurate volume and discharge estimates.
Further differentiation in supply-limited and supply-unlimited basins have improved the predictive capabilities to an extent that multiple regression equations can be used for cursory volume and peak discharge assessments in similar climatic and geologic environments.13
Multivariate approaches usually yield higher predictive skill but cannot be transferred beyond the area or region for which they have been developed. Even within the calibration region, error in volume estimates is usually too large for individual fan studies that require accurate design volume estimates.14
Apart from this limitation, multivariate morphometric studies yield important information on the relative importance of the various input variables that may be very helpful for the design of mitigative measures.
Peak discharge analysis
Peak discharge of the cross-section area of the design event is required for situations in which a pipeline is suspended over a channel. Debris flow peak discharge is defined as:
Qmax = Amax vt
Where: Amax is the maximum cross-section during a debris flow (recognizable by the highest mudline or scour marks), and vt is the velocity during time t when the largest cross-section flow surge passes.
Debris flow peak discharge is rarely measured directly, and where it is (usually at well-instrumented creeks), the design event (the maximum magnitude debris flow for which mitigation structures are to be designed) will often not occur within a human lifetime.
Decades of observations are necessary to determine a frequency—magnitude relationship that would allow the construction of a frequency—discharge relationship that could confidently be extrapolated to the 100 or 500-year return period event.
This may be even more difficult when assessing lahar hazards for very active volcanoes because the eruptive activity is the primary variable in determining debris flow magnitude-frequency relationships. Therefore, debris flow peak discharge must usually be estimated via such things as field observations, empirical methods, and numerical methods.
Field observations
Field observations include cross-section measurements along preferably bedrock channel sections where physical evidence of debris flows is still visible and is unambiguous. Typical evidence includes scour marks on the channel sidewalls well above the expected flood discharge. This can include removal or damage to vegetation. In this case, the cross-section area can easily be measured by measuring tape, inclinometer, and stadia rod.
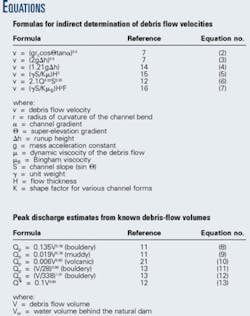
For larger cross-sections, handheld laser range finders are useful, as are detailed topographic maps. Debris flow velocity can be determined from well known equations stemming from fluid mechanics and use of flow superelevation, runup against obstacles, or channel characteristics. The Equations box summarizes some of these formulas.
The super-elevation equation (Equation 2) is based on the assumption that the cross-channel slope is constant and that the channel width is much smaller than rc. Large-scale flume experiments, Iverson, et al.,17 show that the superelevation formula provides reasonable velocity estimates.
The second assumption may be violated when cross-sections for peak discharge estimates are obtained in channel bends.18 19 This is due to the tendency of particularly fast and fine-grained debris flows to display strong concavities in their flow surface that may exaggerate the peak discharge estimates.
The runup, or velocity head, equation can be applied to debris flows impacting obstructions oriented perpendicular to the flow direction. It results from the assumption that all kinetic energy of a moving object is converted to potential energy. The runup equation was found to yield velocities up to 30% lower than those observed in large-scale flume experiments by Wigmosta.14 Wigmosta's formula is based on a combination of empirical measurements and theoretical analysis of laminar viscous flow around a cylinder. He found errors less than 15% for Reynolds numbers greater than 20.
Hungr, et al.'s formula is based on a Newtonian model and uses a shape factor of 3 for infinitely wide rectangular channels and 8 for semicircular channel, based on resistance experiments by Straub, et al.,20 which is based on earlier work by Boussinesq.21
Ideally, the results from several formulas should be compared. In either case, velocity should be rounded to one significant figure because debris flow velocities are highly variable and, for most applications, more-precise measurements of debris flow discharge are unnecessary.
If a channel shows signs of debris flow activity, such as boulder lobes and levees along the channel and on the fan, a number of empirical relationships between volume and peak discharge can determine the variable of interest. Equations 8-13 were developed for debris flows in Japan, British Columbia, China, and Switzerland.
Because of differences in flow resistance, a separation must be made between bouldery debris flows characterized by a steep granular surge front, and fine-grained flows such as lahars that lack a concentration of large boulders at the surge front. Regional calibration is preferred to the blind application of any one of the formulas reported in the Equations box.
Attempts have been made to correlate flood discharge with debris-flow discharge. This correlation forms the basis of calculating debris flow peak discharge in Taiwan.23 The work was pioneered by Takahashi24-25 who postulated that:
Qp=C*/(C*.–.C)Qw
Where: C* is the maximum sediment concentration and C the average sediment concentration.
Jan, et al.,25 rewrote Equation 15 as
Qt=Qw/(1–Cv), where: Qt is the debris flow discharge at any time t, Qw is the water peak discharge, and Cv is the volumetric sediment concentration of the debris flow.
Using a probabilistic approach, Jan, et al., then computed the design debris flow peak discharge (Qd) as:
Qd=Qt+b S(G)
Where: β represents a safety index based on the normal probability distribution and S(G) is the standard deviation of G = Qd – Qt.
As Jan, et al., note, Equation 16 is only valid for in-stream debris flow initiation since it does not account for point-source failure volumes. A similar approach is used in Japan to determine the discharge of debris flow triggered by in-channel mixing of water and sediment to form a debris flow.
This article does not discuss relationships between water discharge and debris flow discharge. It is very important to realize that debris flow peak discharge largely depends on the initiation mechanism (discrete landslide point source vs. in-channel mobilization), the amount of debris entrained (bulked) during the descent of the debris mass in the channel, and channel morphology. None of these three variables is included in Equations 8-16, which suggests the formulas are unreliable in predicting debris flow peak discharge, even if the sediment concentrations are known.
Area inundated analysis
The area inundated must be determined if, for example, a pipeline crosses a creek fan, or a pumphouse is located in the potential runout zone of a debris flow or hyperconcentrated flood. A number of debris flow runout models exist, but these are based on complex hydraulics and require rheologic input variables that are not readily available.
For these cases, a simple but objective empirical method has been developed by Iverson, et al.,26 and Griswold and Iverson27 which relates debris flow volume (V) to the area inundated (B) via:
Bv=200V2/3 (17)
Bb=18V2/3 (18)
Again, a differentiation is made between the area inundated by volcanic debris flows (Bv) and the area inundated by bouldery debris flows (Bb).
Debris entrainment, scour
Predicting debris entrainment and scour remains an active area of research. We recommend field observations and test pitting, coupled with selection of a conservative pipeline burial depth.
Debris flows traverse channels underlain either by bedrock or colluvial material. For bedrock, the amount of material currently stored in the channel can be estimated if the amount of loose debris is known that overlies the bedrock, and the channel morphology can be inferred from sites where bedrock is daylighting. Yield rates in colluvial channels are much more difficult to determine and are one of the biggest unresolved issues in debris flow science.
To determine yield rates in bedrock-underlain channels, the observer must hike the channel and measure the width and average depth of the channel fill. That will result in a yield rate expressed in cu m/m channel length.15 This should be repeated whenever the channel geometry or the depth of channel fill changes. The resultant volumes for each reach are summed to the highest point in a watershed from where debris flow initiation is conceivable.
Average yield rates in western British Columbia and Washington State vary between 5 and 30 cu m/m.28 Yield rate strongly depends on channel recharge rates and the time passed since the last debris flow.
Channel aggradation, degradation
Debris flows and debris floods often deposit large volumes of sediment in the lower reaches of channels and on alluvial fans. Subsequent stream flow can result in rapid channel degradation.
The authors have seen several locations where pipeline design burial depth was selected shortly after a period of high debris flow, and the ongoing channel degradation potential was not properly accounted for. This can result in pipeline exposure, and in one case rupture. Again, selection of pipe burial depth using a geomorphic approach can help minimize the impacts of these processes.
If hydrologic information is scarce, a simple method based on watershed area comparisons gives approximate results. In cases with ample data, complex methods are applied with more reliable results.
Although hydrologists have been aware of special flood conditions,27 there is no routine procedure in place to account for geomorphic events whose effects may destroy pipelines.
Acknowledgments
The authors thank Jim Schwab for photographs of the PNG rock avalanches. Thanks also to Transredes SA for permission to describe the OCC case history and to PNG for permission to describe the case studies in northern British Columbia.
References
1. Jakob, M., and Jordan, P., "Design flood estimates in mountain streams – the need for a geomorphic approach," Canadian Journal of Civil Engineering, Vol. 28 (3), 2001, pp. 425-39.
2. Scott, K.M., and Vallance, J.W., "Debris flow, debris avalanche, and flood hazards at and downstream from Mount Rainier, Washington," US Geological Survey Hydrologic Investigations Atlas 729, 2 Sheets and accompanying Pamphlet, 1995.
3. Schwab, J.W., Geertsema, M., Evans, S.G., "Catastrophic rock avalanches, west-central British Columbia," Third Canadian Conference on Geotechnique and Natural Hazards, Edmonton, 2003, pp. 291-98.
4. Clarke, G.K.C., "An estimate of the magnitude of outburst floods from Lake Donjek, Yukon Territory, Canada," Canadian Department of Indian and Northern Affairs, 1980.
5. Perchanok, M.S., "Improved flood estimates on Donjek River—Final Report," Canadian Department of Indian and Northern Affairs, 1980.
6. Gray, D.M. (ed.), Handbook on the Principles of Hydrology, National Research Council of Canada, 1970.
7. Chow, V.T., Open channel hydraulics, New York: McGraw Hill, 1979.
8. Coulson, C.H., Manual of operational hydrology in British Columbia, Second Edition, Ministry of Environment, Water Management Division, Hydrology Section, 1991.
9. Tribe, S., and Leir, M., "The Role of Aerial Photograph Interpretation in Natural Hazard and Risk Assessment," IPC 2004, 5th International Pipeline Conference, Calgary, Oct. 4-8, 2004.
10. Bovis, M.J., and Jakob, M., "The role of debris supply conditions on predicting debris flow activity," Earth Surface Processes and Landforms, Vol. 24 (1999), pp. 1039-54.
11. Mizuyama, T., Kobashi, S., and Ou, G., "Prediction of debris flow peak discharge," Proceedings of the International Symposium Interpraevent, Bern, Switzerland, 1992, pp. 99-108.
12. Rickenmann, D., "Empirical relationships for debris flows," Natural Hazards Vol. 19 (1999), pp. 47-77.
13. Jakob, M., "Morphometric and geotechnical controls of debris flow frequency and magnitude in southwestern British Columbia," unpublished PhD. thesis, University of British Columbia, 1996.
14. Wigmosta, M.S., "Rheology and flow dynamics of the Toutle debris flows from Mt. St. Helens," Unpublished MSc. thesis, University of Washington, 1983, 184 p.
15. Hungr. O., Morgan, G.C., and Kellerhals, R., "Quantitative analysis of debris torrent hazards for design of remedial measures," Canadian Geotechnical Journal, Vol. 21 (1984), pp. 663-77.
16. Jordan, P.R., "Debris flows in the southern Coast Mountains, British Columbia: dynamic behaviour and physical properties," unpublished PhD thesis, 1994, 258 p.
17. Iverson, R.M., LaHusen, R.G., Major, J.J., and Zimmerman, C.L., "Debris flow against obstacles and bends: dynamics and deposits," (abs.): EOS, 75 (44) 1994: 274 p.
18. Webb, R.H., Pringle, P.T., and Rink, G.R., "Debris flows from tributaries of the Colorado River, Grand Canyon National Park Arizona," US Geological Survey Professional Paper 1492, 1989, 39 p.
19. Jakob, M., Hungr. O., and Thomson, B., "Two debris flows with anomalously high magnitude," In: Chen, L.-l. (ed.) Debris flow hazards Mitigation: Mechanics, Prediction and Assessment, Proceedings of the First International Conference, American Society of Civil Engineers, 1997, pp. 382-94.
20. Straub, L.G., Silberman, E., and Nelson, H.C., "Open channel flow at small Reynolds numbers," Transactions, American Society of Civil Engineers, Vol. 123 (1958), pp, 685-706.
21. Boussinesq, J., "Memoir sur l'influence des frottements dans les mouvements reguliers des fluids," Journal de Mathématiques Pures et Appliqués, Series 2, 1868, 13: pp. 377-424.
22. Jitousono, T., Shimokawa, E., and Tsuchiqa, S., "Debris flow following the 1994 eruption with pyroclastic flows in Merapi volcano, Indonesia," Journal of the Japanese Society of Erosion Control Engineering, Vol. 48 (1996), pp. 109-16.
23. Jan, C.D., Lee, M.H., and Chen, J.C., "Reliability analysis of design discharge of debris flow," In: Rickenmann, D., and Chen, C.-l., Debris-flow hazards mitigation: mechanics, prediction and assessment, Rotterdam: Millpress, 2003, pp. 1163-71.
24. Takahashi, T., Mechanical characteristics of debris flow, Journal of the Hydraulics Division ASCE, 1978, HY8: pp. 1153-69.
25. Takahashi, T., Debris flow, IAHR Monograph Series, Rotterdam: Balkema, 1999.
26. Iverson, R.M., Schilling, S.P., and Vallance, J.W., "Objective delineation of lahar-inundation hazard zones," GSA Bulletin 110 (8), 1998, pp. 972-84.
27. Griswold, J.P., and Iverson, R.M., "Debris-flow hazard maps generated using LIDAR topography, statistically-calibrated inundation equations, and GIS," Association of Engineering Geologists 46th Annual Meeting, Sept. 15-20, 2003, Vail, Colo.
28. Hungr, O., McDougal, S., and Bovis, M.J., "Debris entrainment by debris flows," Jakob, M., and Hungr, O. (eds.) Debris flow hazards and related phenomena, Springer-Praxis, 2005.
29. Watt, W.E. (ed.), Hydrology of Floods in Canada, A Guide to Planning and Design, Ottawa: National Research Council Canada, 1989.
Based on a presentation to ASME's 4th International Pipeline Conference, Oct. 4-8, 2004, Calgary.
The authors
Matthias Jakob ([email protected]) is a senior geoscientist for BGC Engineering Inc., Vancouver. He works on hazard and risk assessment for local governments, private clients (such as railways), oil and gas companies, and the Canadian government.
Jakob holds a Vordiplom degree (BSc) from the University of Regensburg, Germany. After studying at the University of Colorado, Boulder, specializing in mountain geomorphology, he received an MSc from the University of Heidelberg, Germany. He also studied rockglaciers in the Nepalese Himalayas. Jakob received a PhD from the University of British Columbia in 1996.
Michael Porter ([email protected]) is a senior geological engineer for BGC Engineering Inc., Vancouver. His work focuses on geohazard risk management for pipelines and other linear facilities, with particular emphasis on projects located in the Canadian Cordillera and the Andes of South America.
Porter holds a BA in geological engineering from the University of British Columbia and an ME in geotechnical engineering from the University of Alberta.
Wayne Savigny (wsavigny@ bgcengineering.ca) is vice-president of BGC Engineering Inc., Vancouver. He has more than 30 years' experience with geohazards and related risks affecting pipelines in North and South America. Savigny also has served as a professor in the geological engineering program at the University of British Columbia and continues there as an adjunct professor. He is a registered professional engineer and geoscientist in Alberta, British Columbia, and Northwest Territories. Savigny is a member of the Canadian Geotechnical Society, Canadian Society of Petroleum Geologists, Geological Association of Canada and Association of Engineering Geologists, and a Fellow of the Geological Society of London. He holds a BASc (Hons). degree in geological engineering from Queen's University and a PhD in civil (geotechnical) engineering from the University of Alberta.
