Defect Assessment—1: Modified equation aids integrity management
A modified Ln-Sec equation should replace the original Ln-Sec equation for all grades of pipe through X80 with full-size Charpy energies of 15 ft-lb and higher. This first part of two articles reviews development of the original Ln-Sec equation and examines its shortcomings.
The concluding article (next week) will present a modified Ln-Sec equation and explain how it improves the original.
Background
Bill Maxey conceived the Ln-Sec equation, also known as the NG-18 Surface Flaw equation, at Battelle in the late 1960s while conducting research on failures in pressurized pipes and pipelines. He first developed a surface flaw equation empirically curve-fit to the results of burst tests on stainless steel nuclear power piping. He subsequently found that a theoretical equation developed by E.S. Folias satisfactorily accounted for the effect of axial flaw length in his empirical equation.1
In attempting to apply his surface flaw equation to carbon steel pipes such as those used in natural gas pipelines, Maxey found the Dugdale model for crack opening displacement in the form of an Ln-Secant function presented a reasonable means of correcting for reduced failure pressures associated with pipe materials of suboptimal toughness.
The Ln-Secant-corrected equation eventually became known as the NG-18 Surface Flaw equation because most validating full-scale pipe tests were sponsored by the NG-18 Line Pipe Research Committee of the American Gas Association (the forerunner of PRCI).
The Ln-Sec equation is still highly regarded as a method for predicting failure pressure for axially-oriented surface flaws in pipelines despite the development of other quite-satisfactory methods (PAFFC, CorLas, and API RP 579). The simplicity of the Ln-Sec equation and its validation by numerous full-scale experiments probably account for its continued use despite known limitations.
This article introduces a modification to the Ln-Sec equation eliminating the main limitation of the original equation: its tendency to underestimate failure pressures of long, shallow defects. The original equation had severe limits regarding remaining life predictions for crack-like defects in materials with suboptimal toughness. The modified version, however, satisfactorily overcomes this limitation, allowing it to be used with confidence for both remaining life assessments and failure stress predictions.
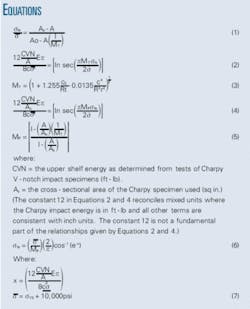
Equation 1 gives satisfactory predictions of failure stress for axial surface flaws in extremely tough materials such as stainless steel, and for blunt axial flaws in carbon steel materials such as corrosion-caused metal loss irrespective of toughness. It provides the basis for most equations used by the pipeline industry to evaluate the remaining strength of corroded pipe (B31G, Modified B31G, RSTRENG, API RP 579 Level I assessment for locally-thinned areas, and DNV RP F101).
Full-scale testing of line pipe materials containing crack-like flaws, however, showed that Equation 1 tended to overestimate the hoop stress at failure, especially for large-diameter pipe (24-42 in. OD). The degree of overestimation correlated with the Charpy V-notch upper shelf energies of the materials.
Original Ln-Sec
Acting on the observation that Equation 1 tended to give less and less accurate predictions as the level of Charpy energy of the material decreased, Maxey postulated Charpy upper-shelf energy should be proportional to the ductile fracture resistance of a material with suboptimal toughness. He showed the Charpy energy of a carbon steel pipe material to be roughly equal to the strain energy release rate of crack formation, G, which Irwin had shown to equal KIc2/E, where KIc is the plane strain fracture toughness and E is the elastic modulus of the material.
Maxey further postulated Equation 1 could be corrected for materials that failed in a ductile manner but which exhibited suboptimal toughness by means of the Dugdale model.2 The Dugdale model embodies a Ln-Secant functional representation of crack-tip opening displacement for a material exhibiting plastic strain at the tips of flaws before fracturing. Combining the concepts of Charpy energy, the Dugdale model, and Equation 1 yielded two failure criteria, one for through-wall flaws (Equations 2-3) and one for surface flaws (Equations 4-5).
Equation 6 shows sfs, the predicted hoop stress at failure for a surface flaw.
Maxey’s review of full-scale test data showed the most appropriate value of flow stress for line pipe material as described by Equation 7.
He also suggested a three-term Folias factor (Equation 3) be used as it is less conservative than the original Folias factor. Equations 2 and 4 became known as the Ln-Sec equations and are often also referred to as the NG-18 Surface Flaw equations.3
Validation for line pipe materials involved burst tests of 35 end-capped pipes containing longitudinally oriented uniform-depth V-shaped notches of various lengths and depth-to-thickness ratios.
The 35 materials’ exhibited 2/3-size Charpy upper-shelf energy levels ranging from 10 ft-lb to 34 ft-lb (full-size equivalents of 15 ft-lb to 51 ft-lb).3
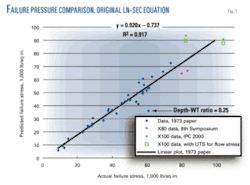
The material’s grade ranged from X52 through X65, with actual yield strengths of 55,000-73,900 psi. Fig. 1 shows the correlation between predicted and actual failure pressures for the 35 experiments.
One experiment, with a notch-depth-to-WT ratio of 0.25, deserves particular attention due to its implications regarding use of the original Ln-Sec Equation with shallow defects. This was the only experiment in which the notch had such a low depth-WT ratio. The other experiments involved notches with depth-WT ratios of 0.38-0.92. The failure pressure of the pipe with the 0.25-ratio flaw stands as an outlier (Fig. 1).
Regression fitting the data including this result yields an R2 value of 0.92. Excluding the one shallow-flaw experiment, however, changes the R2 to 0.96, suggesting the original Ln-Sec Equation tends to give excessively conservative predictions for failure stress of shallow flaws.
The lack of additional shallow-flaw results and early use of this equation for predicting failure pressure led this deficiency to be regarded as unimportant. Because of little interest in shallow flaws not posing an imminent threat to the integrity of a pipeline at normal operating stresses, the inaccuracy of the model for shallow flaws was not viewed as a detriment, nor did much incentive exist to perform expensive burst tests of pipe samples with shallow flaws.
Overconservatism with respect to shallow flaws becomes important, however, when Equation 4 is applied to remaining-life assessments in which the flaws surviving a hydrostatic test or remaining undetected by in-line inspection are relatively shallow. Equation 4 becomes particularly problematic in cases involving line pipe materials with suboptimal toughness.
Additional testing
Additional full-scale tests have followed publication of these data. Three tests conducted on X80 material4 and two on X100 material5 hold particular interest. The X80 data fit the original correlation but one of the X100 results does not.
The model overestimates the failure pressure for one of the X100 tests. The X100 test which appears to fit the trend involved a shallow-defect test (depth-WT = 0.2), prompting expectations the original Ln-Sec Equation would under-estimate the failure pressure. At the 100,000-psi strength level, however, the use of yield strength plus 10,000 psi for flow stress was inappropriate and could have contributed to the unexpected result by causing the flow stress to be higher than the ultimate tensile strength of the material.
Even when replotted with ultimate tensile strength as flow stress, however, one point still lies above the trendline of the original data and the other would as well if not for representing a shallow-flaw experiment.
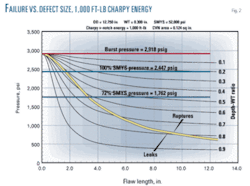
The nature of the shallow-flaw deficiency emerges most clearly by comparing Fig. 2 with Fig. 3. Fig. 2 shows rectangular surface flaws with depth-WT ratios of 0.1-0.9 for a 12.75-in. OD, 0.3-in. WT, X52 pipe material with 1,000 ft-lb or higher full-size Charpy V-notch upper shelf energy.
This level of Charpy energy stands well beyond any level expected for actual line pipe material, showing that, for a material of optimum toughness, failure pressure level for any given defect is independent of toughness, depending instead entirely on flow-stress, and therefore, predictable by means of Maxey’s surface flaw equation (Equation 1). The inverse Ln-Secant correction for a 1,000 ft-lb material is essentially π/2, reducing Equation 6 to Equation 1.
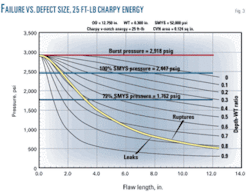
Fig. 3 shows a set of curves for pipe material with the same geometry and same grade steel shown in Fig. 2 but exhibiting a full-size Charpy upper shelf energy of 25 ft-lb.
Predicted failure pressures for the 25 ft-lb material are in all cases less than those predicted for the 1,000 ft-lb material. The fact the depth-WT = 0 curve does not coincide with the burst pressure of a defect-free pipe (labeled burst pressure = 2,918 psig) makes Equation 4’s problem clear.
Logic suggests the pipe should fail at its burst pressure for a zero-depth defect. The original Ln-Sec equation, however, allows correction for any nonzero defect length even though the defect depth is zero. The lack of perceived threat from such deficiencies has allowed it to be largely ignored, despite general recognition of the original equation’s limitations. Fig. 1 shows a good fit for experiments with depth-to-thickness ratios of 0.38 or more; defects that would pose a potential threat to the integrity of a pipeline at operating stress levels.
The original Ln-Sec equation gives conservative estimations of failure pressure, but its use with materials having suboptimal toughness can result in underestimation of the depths of defects that could survive such pressure, potentially leading to overestimation of remaining life in a remaining-life assessment.
Fig. 3 shows such a circumstance, suggesting an 11-in. long flaw with essentially zero depth would barely survive a hydrostatic test to 100% of SMYS and yielding the absurd conclusion that a test to 100% of SMYS ensures the pipe is free of defects longer than 11 in. In reality, however, the incorrectness of the shallow-flaw curves prevents use of the original Ln-Sec equation for remaining-life assessments of materials with less-than-optimum toughness. ¿
References
- Folias, E.S., “The Stresses in a Cylindrical Shell Containing an Axial Crack,” Aerospace Research Laboratories, ARL 64-174, October 1964.
- Dugdale, D.S., “Yielding in Steel Sheets Containing Slits,” Journal of the Mechanics and Physics of Solids, Vol. 8, pp. 100-104, 1960.
- Kiefner, J.F., Maxey, W.A., Eiber, R.J., and Duffy, A.R., “Failure Stress Levels of Flaws in Pressurized Cylinders,” Progress in Flaw Growth and Fracture Toughness Testing, ASTM STP 536, American Society for Testing and Materials, pp. 461-481, 1973.
- Kubo, T., Shiwaku, T., Kondo, J., Miyazaki, H., and Kawaguchi, Y., “Proposal of Modified Specimen for Chevron Notch Drop Weight Tear Test,” Eighth Symposium on Line Pipe Research, Pipeline Research Committee, American Gas Association, Houston, Sept. 26-29, 1993.
- Demofonti, G., Mannucci, G., Barsanti, L., Spinelli, C.M., and Hillenbrand, H.G., “Fracture Behavior and Defect Evaluation of Large Diameter, HLSA Steels, Very High Pressure Linepipes,” Vol. 1, Proceedings of the Third International Pipeline Conference, American Society of Mechanical Engineers, pp. 537-545, Calgary, Oct. 1-5, 2000.
The author
John F. Kiefner ([email protected]) is a senior advisor at Kiefner & Associates, a firm he founded in 1990. Although officially retired, he still works part-time for the company. During his 40-year career, Kiefner has specialized in developing and using analytical methods for assessing pipeline integrity and in conducting research on pipeline material behavior and pipeline defects and repair methods. Kiefner received his BS and MS degrees in civil engineering from Purdue University in West Lafayette, Ind., and his PhD from the University of Illinois in Champaign-Urbana, Ill. He is a registered professional engineer in Ohio and a member of ASME.
Correction
In the article “Natural gas pipeline profits surge; oil flat,” by Christopher E. Smith, Tables 4 and 7 (OGJ, Sept. 1, 2008, p. 58 and 62) contained errors. Below are corrected versions of the affected portions of each table. The corresponding data have also been updated in the OGJ Energy Database.
null
