Open-source resources help navigate new IM regulations
N. Simon Kwong
Kishor S. Jaiswal
US Geological Survey
Golden, Colo.
Jack W. Baker
Stanford University
Stanford, Calif.
Nicolas Luco
Kristin A. Ludwig
Vasey J. Stephens
US Geological Survey
Golden, Colo.
The revision of federal safety regulations for integrity management of gas transmission pipelines to require explicit consideration of seismicity increases the importance for operators to be actively identifying high-consequence areas (HCAs), evaluating seismic-related threats, and choosing a risk model to support risk management decisions. To ensure equal access to information by both operators and inspectors, the authors have compiled publicly available data and tools for practical seismic risk assessments, such as Microsoft building footprints, the USGS National Seismic Hazard Models, and the USGS Ground Failure product.
This article will present three examples of how open-source resources can help alleviate key difficulties. In the first example, Microsoft building footprints were used to check identification of HCAs from annual reports for the conterminous US (CONUS). The two sets of HCA classification agree reasonably well at the aggregate level but differ at finer resolutions, which can facilitate conversations between operators and inspectors on confirming HCA. In the second example, the USGS NSHM was used to estimate the exposure for seismically induced strong ground shaking across the CONUS, and in the third example, the NSHM was further integrated with two models from the USGS Ground Failure product to estimate exposure for seismically induced ground failures across the CONUS.
These exposure estimates enable initial screening and facilitate decisions on whether more reliable assessments that require data of finer spatial resolution are needed. Furthermore, these exposure estimates can be compared with alternate estimates before calculating likelihood of failures in practical seismic risk assessments.
The resources discussed in this article naturally have limitations (e.g., they do not inform all elements of relevance to integrity management programs (IMPs). But they have great utility in that the data provide national coverage and are equally available to operators and inspectors, which allows for transparent and consistent assessment. Further, the USGS resources are highly relevant for new requirements regarding explicit consideration of seismicity in IMPs. Cases with differing interpretations between operators and inspectors will still require more careful consideration, but these open-source resources have the potential to greatly reduce and simplify such situations.
Background
Federal safety regulations for integrity management of natural gas transmission pipelines in the US have been revised recently to require explicit consideration of seismicity. Regulations in place since 2004 require operators to develop, implement, and continuously improve IMPs for gas transmission pipelines traversing HCAs, which are essentially zones of high population.1-2 Among other responsibilities in this process, operators also must identify HCAs, evaluate threats at HCAs, and choose the approach to assess risks from each threat.3 At the same time, inspectors from state utility commissions and federal agencies are responsible for verifying IMP compliance.
Recent gas pipeline incidents (e.g., 2010 explosion in San Bruno, Calif., 2012 fire near Sissonville, W. Va.) have revealed limits of IMP effectiveness.4-5 For example, while operators can choose among two methods to identify HCA, state inspectors have found it difficult to verify compliance of these HCA classifications.3 In fact, these inspectors have found it most difficult to verify the approach operators have taken to identify credible threats or equivalently, dismiss non-credible threats.3
Prompted by lessons learned from such gas pipeline incidents, federal safety regulations were recently updated.6 Among the changes, new regulations now require operators to explicitly consider and account for seismicity in identifying and evaluating potential threats. This article summarizes potential key difficulties in executing practical seismic risk assessments, compiles data and tools that are accessible to both operators and inspectors, and exemplifies how these open-source resources can help alleviate the problems faced. For example, open-source building footprints can help confirm HCAs, and data from the USGS can help check estimates of exposure when calculating likelihood of failure in practical seismic risk assessments. Cases with differing interpretations between operators and inspectors may need more careful consideration, but these open-source resources provide national coverage and have the potential to greatly reduce and simplify such situations.
Seismicity, integrity management
Although integrity management consists of 16 continuously evaluated elements, this article focuses on three key aspects of it: HCA identification, threat identification, and risk assessment.2 In the first aspect, the operator identifies portions of a gas transmission pipeline system as HCA using one of two acceptable methods. In the first method, an area is essentially identified as HCA if it is either (i) a Class 3 or Class 4 location, or (ii) a Class 1 or Class 2 location with a potential impact circle containing either an “identified site” or 20 or more dwellings.2 Both acceptable methods determine potential impact circles along pipelines, which require knowledge of the energy contents of the gas, pipe diameters, and maximum allowable operating pressures (MAOP).2
In the second aspect, the operator identifies all potential threats to each HCA segment and evaluates pipeline susceptibility to, or likelihood of, these threats occurring. Different operators may evaluate threats differently.3 According to ASME B31.8S, there are a total of nine categories of threats, and seismicity falls under “Weather-related/outside forces,” which is a time-independent threat type.1 The likelihood of a given unmitigated threat occurring is commonly referred to as “exposure.” For time-independent threats such as seismicity, exposure can be measured in number of events per year, or number of events per year per mile. For rare events, number of events per year (i.e., annual frequency) is roughly equal to annual probability of the event.7-8
In the third key aspect, the operator assesses the risks from failure of each HCA segment due to each identified threat and uses the risk results to (i) prioritize segments, (ii) choose methods of integrity assessments, and (iii) determine preventive or mitigative measures. In this context, “risk” is defined as the mathematical product of the likelihood of failure (LOF) and the consequences of that failure (COF). LOF depends on threat exposure, pipeline mitigation, and pipeline resistance.7-8 Operators are free to choose from one of four risk models for assessing risks (i.e., qualitative, relative assessment, quantitative system, or probabilistic).9
This summary of the three key aspects of IMP highlights the flexibility granted to operators to identify HCAs, evaluate threats, and assess risks. This flexibility enables handling of unique, case-by-case situations and avoids imposing unnecessary burdens on operators. But it also may make it difficult for inspectors to verify IMP compliance.3 For example, inspectors might not have information on pipe diameters, but pipe diameter is needed to determine potential impact circles and resulting HCAs. Furthermore, considerable expertise is required to understand the methods chosen by operators to evaluate threats and assess risks (e.g., most operators contracted with an external consultant to help develop their risk models). Therefore, key problems in establishing effective IMPs include (i) identifying HCAs, (ii) evaluating seismic-related threats, and (iii) choosing an effective model to support risk management decisions.
Explicitly considering seismicity in IMPs can amplify these problems. First, while IMPs are required at HCA segments, assessing risks to non-HCA segments can also become important because earthquake shaking may affect a large geospatial region. Second, earthquakes can trigger other threats beyond strong ground shaking such as liquefaction, landslides, and surface faulting (i.e., ground failures), potentially requiring additional expertise.10-11 Third, while the gas industry has been moving towards more quantitative risk models, the relatively infrequent occurrence of damaging earthquakes can make it difficult to assess seismic risks using empirical data alone.9
Open-source data, tools
Data and tools that are publicly accessible to both operators and inspectors can help alleviate the challenges of verifying HCA, evaluating seismic-related threats, and assessing risks. As one example, Microsoft has used computer vision algorithms on satellite imagery to generate open-source building footprints within the US.12 The US Department of Homeland Security (DHS) provides Homeland Infrastructure Foundation-Level Data (HIFLD), which contain open-source locations of critical facilities such as fire stations, hospitals, and police stations.13 Also, the Oak Ridge National Laboratory uses a mixture of techniques to develop LandScan USA, which estimates US population counts at 3 arc-second (about 90 m) resolution.
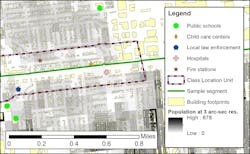
The preceding datasets can help operators and inspectors confirm identification of HCAs and check estimated consequences of pipeline failure. For example, Fig. 1 illustrates a sample pipeline segment in solid dark green and a sample “class location unit” in dashed purple, which is defined as an onshore area that extends 220 yards (200 m) on either side of the centerline of any continuous 1-mile (1.6 km) length of pipeline and also known as “location class” in the ASME B31.8S standard.1-2 Fig. 1 also shows building footprints from Microsoft, critical facilities from HIFLD, and population density from LandScan USA. Building footprint counts within the class location unit can help identify HCAs, as will be elaborated on in the next section. These open-source data can help prioritize HCA segments via potential consequences. For example, both a fire station and a hospital are within the class location unit of the sample pipeline, which increases the likelihood of cascading consequences when either are damaged.
Besides identification of HCAs, open-source data are also available for evaluating seismic-related threats. For example, the US Geological Survey (USGS) has developed National Seismic Hazard Models (NSHM) that provide probabilistic estimates of seismic hazard across the country.15
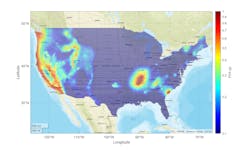
Based on hazard data from the 2018 NSHM calculated on a 0.05 by 0.05-degree grid (about 5 km), Fig. 2 shows the distribution of peak ground acceleration (PGA) corresponding to a 2% probability of exceedance in 50 years within the conterminous US (CONUS) at a reference soil condition of Vs30 = 760 m/sec, where Vs30 refers to the time-averaged shear-wave velocity in the upper 30 m below the ground surface.16-17 For the first time, the 2018 NSHM also provides hazard data for other values of Vs30, which enable hazard adjustments using user-specified values of Vs30.18 Similar maps of PGA have been used in conjunction with PGA thresholds to screen potential severity of seismic hazards to gas transmission pipelines.19 In the absence of precise estimates of Vs30 at specific sites, initial topographic-based estimates of Vs30 are available from the USGS global server.17 20 Geologic and gseophysical profiles are also available from the USGS National Crustal Model (NCM).21-22
Peak ground velocity (PGV) has been linked to seismic damage of gas transmission pipelines from strong ground shaking due to the approximate relationship between PGV and longitudinal ground strain.23-25 Furthermore, PGV plays an important role in estimating potential damage from earthquake-induced ground failures. Consequently, ShakeMaps of PGV are regularly used to estimate potential ground failures in the USGS Ground Failure product.26-29 Specifically, the USGS Ground Failure product uses globally available datasets and statistical models to estimate the conditional probability of liquefaction or seismically induced landslides at a resolution of 30 arc-second (about 1 km).
While these probability estimates may be useful in a two-phase assessment approach in which significant risks are first screened before conducting more comprehensive analyses, they are not a substitute for localized assessments with data at finer spatial resolution.30 Specifically, the statistical models are limited in that (i) the pool of useful candidate predictor variables is constrained by the need to train the model with globally available datasets, (ii) the underlying earthquake case histories might not adequately represent the conditional probability of ground failure in the central and eastern US, and (iii) the model resolution is not fine enough to capture settings where geohazards at finer spatial resolution may cause damage to pipelines. Given the importance of PGV in seismic risk assessments of pipelines, the USGS has recently initiated support for PGV in NSHM, as seen in Fig. 3.31-32
Open-source resources are also available for other aspects of seismic risk assessment for gas pipelines. For example, the USGS recently updated fault traces for the next update of the NSHM, which could inform surface faulting assessment.33 Moreover, the US Environmental Protection Agency provides a free tool for estimating consequences from a gas pipeline failure.34 Finally, the USGS ShakeCast tool helps monitor potential seismic damage to assets.35-36
Checking HCA identification
The Pipeline and Hazardous Materials Safety Administration (PHMSA) annually collects geospatial data on gas transmission pipelines from operators via the National Pipeline Mapping System (NPMS).37 PHMSA also collects aggregate statistics (e.g., distribution of total asset mileage by HCA classification) from operators via annual reports.38 While the NPMS is an important resource for both federal and state inspectors to assess operators’ IMPs, it does not provide information on HCAs, which limits its utility for inspections.3
Open-source data such as the Microsoft building footprint can help enhance NPMS’ utility for inspections.12 To illustrate, we used the building footprints to roughly check identification of HCA from the 2018 annual reports for CONUS. First, we obtained the 2018 NPMS pipeline dataset for CONUS from PHMSA and then discretized the pipeline segments into 1-mile subsegments to approximately identify class location units for each pipeline segment. Next, we counted the number of building footprints within each subsegment’s class location unit and identified subsegments with 46 or more footprints as HCA (essentially assuming all Class 3 locations are HCA).2 This approach is approximate because a building footprint can contain multiple dwelling units, the number of identified sites can be underestimated, and potential impact circles are excluded. However, the approach may still be useful to inspectors who have access to approximate geospatial locations of pipelines but not the pipe diameters or MAOP required for determining potential impact circles.
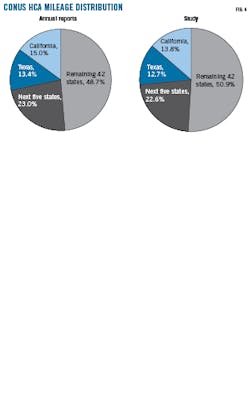
In an aggregate level, the approximate HCA classifications agree with those in the 2018 annual reports. For example, the approximate approach indicates that 6.4% of the total mileage in CONUS is classified as HCA, whereas the annual reports indicate 6.9%. This underestimation is expected as the approximate approach essentially uses Class 3 locations only. Fig. 4 shows that the distribution of HCA mileage by state is relatively consistent between the approximate approach and the annual reports. For example, both sources show that most HCA mileage exists in California, underscoring the importance of seismicity in IMPs. At finer resolutions, the HCAs differ among the two sources of information, which can facilitate conversations between operators and inspectors on confirming HCAs.
Estimating ground-shaking exposure
As noted earlier in this article, IMPs are required for HCAs and two key aspects of IMPs include threat evaluation and risk assessment. Both aspects require estimating the likelihood of unmitigated threat occurrence, and this likelihood is called “exposure” in LOF calculations for risk.7 When calculating LOF, operators commonly have information readily available to support estimates of mitigation and resistance but not exposure.8
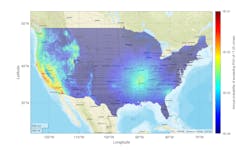
USGS resources such as the NSHM can help check estimates of exposure for seismicity-related threats before proceeding with more comprehensive analyses. Using strong ground shaking as an example, researchers have used classical probit analyses to conclude that gas pipeline leaks are likely to occur when PGV exceeds 17.05 cm/sec.8 39 At the same time, annual frequencies of exceeding different thresholds of PGV are now readily available from the 2018 NSHM.31-32 Furthermore, these hazard data can now be adjusted to user-specified estimates of Vs30, which is important because using a single reference value of Vs30 for the entire country tends to underestimate risk.40-41 To illustrate, we interpolated the PGV hazard data for the PGV threshold of 17.05 cm/sec and adjusted the interpolated hazard with topographic-based estimates of Vs30 from the USGS global server.
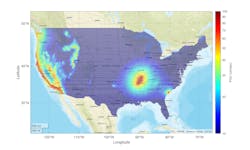
The resulting spatial distribution across CONUS of annual probability of PGV exceeding 17.05 cm/sec is shown in Fig. 5 (calculated on a 0.05 by 0.05-degree grid), which can be compared with other estimates of exposure for seismically induced strong ground shaking. The figure shows that the exposure is highest within the state of California. Multiple efforts are underway to advance understanding of the earthquake threat to California gas pipelines, such as open-source case histories on seismic performance of natural gas infrastructure and open-source tools for seismic risk assessments.43-44 While California has relatively high exposure, other parts of the western United States, the New Madrid seismic zone (i.e., northeastern Arkansas, southeastern Missouri, southwestern Kentucky, and northwestern Tennessee), and South Carolina have moderate exposure. Exposure estimates can be compared before calculating LOF in practical seismic risk assessments, which can facilitate more discussions and refinement among operators and inspectors.
Estimating ground-failure exposure
Besides strong ground shaking, earthquakes can also trigger ground failure such as liquefaction, landslides, and surface faulting.10 23 Estimating the exposure for such ground failures is difficult because it usually requires data on subsurface properties at fine spatial resolutions (e.g., using data from borings to estimate cyclic resistance ratios for liquefaction.11 Estimating the exposure for ground failure is also difficult because the triggering of ground failure depends on the input level of ground shaking.
The USGS Ground Failure product can help check estimates of exposure for geohazards such as liquefaction and landslides.27 For example, two preferred models in the USGS Ground Failure product are routinely used to estimate the conditional probability of liquefaction and earthquake-induced landslides.28-29 The original version of these two models depends on a PGV value, v, and explanatory proxies (θexplanatory) that can be estimated using globally available datasets. For the liquefaction model the explanatory proxies include Vs30, water table depth, mean annual precipitation, and distance to the closest water body.28 For the landslide model the explanatory proxies include topographic slope, lithology, compound topographic index, and land cover.29
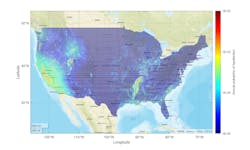
Integrating the recently developed PGV hazard data from NSHM with the liquefaction model gives the annualized probability of liquefaction (Fig. 6). More precisely, at a given grid point within the 0.05 by 0.05-degree grid used in the NSHM, the PGV hazard curve (i.e., annual frequency of exceeding PGV) can be adjusted with user-specified estimates of Vs30, denoted by λPGV(v). For a given level of PGV, v, the PGV hazard curve provides approximate annual frequencies of occurrence, |dλPGV(v)|, and the liquefaction model estimates the conditional probability of ground failure, Pr(GF | v, θexplanatory).28 Integrating these conditional probabilities for all possible levels of PGV gives the annual frequency of ground failure (see equation).
Converting the annual frequencies of liquefaction at all grid points with a typical Poisson assumption leads to the annual probabilities of liquefaction shown in Fig. 6. In this example, relatively high exposure is observed in various locations in the western US and near the Mississippi River.
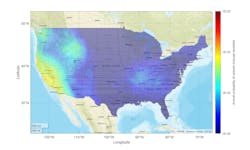
Similarly, integrating the PGV hazard data with the landslide model gives the annualized probability of seismically induced landslide (Fig. 7).29 Relatively high exposure is observed in various parts of California and less exposure is observed in the New Madrid seismic zone.
The exposure estimates for ground failure (Figs. 6-7) are lower than those for ground shaking (Fig. 5) because triggering of ground failure depends on the input level of shaking (see equation). Note that numerical estimates from the ground failure models depend on estimates for the input explanatory proxies (e.g., Vs30).
While globally available datasets were used to estimate these proxies, uncertainty in these estimates exists, which propagates to exposure estimates. Nevertheless, these exposure estimates enable initial screening to facilitate decisions on whether more reliable assessments that require data of finer spatial resolution are needed. For example, the 2005 guidelines by the American Lifelines Alliance on assessing performance of gas pipeline systems recommend a two-phase approach in which initial screening is conducted in the first phase and more comprehensive analyses are conducted in the second phase.30
References
- American Society of Mechanical Engineers (ASME), “Gas transmission and distribution piping systems (ASME B31.8),” New York, NY, 2020.
- Office of the Federal Register, “Title 49 Code of Federal Regulations, Subtitle B, Chapter 1, Subchapter D: Pipeline Safety,” 2021.
- National Transportation Safety Board (NTSB), “Integrity Management of Gas Transmission Pipelines in High Consequence Areas,” Safety Study NTSB/SS-15/01, Washington, DC, 2015.
- NTSB, “Pacific gas and electric company natural gas transmission pipeline rupture and fire San Bruno, California September 9, 2010,” Pipeline Accident Report NTSB/PAR-11/01, Washington, DC, 2011.
- NTSB, “Columbia Gas Transmission Corporation pipeline rupture Sissonville, West Virginia December 11, 2012,” Pipeline Accident Report. NTSB/PAR-14/01, Washington, DC, 2014.
- Pipeline and Hazardous Materials Safety Administration (PHMSA), “Pipeline Safety: Safety of Gas Transmission Pipelines: MAOP Reconfirmation, Expansion of Assessment Requirements, and Other Related Amendments,” Federal Register, 2019.
- Muhlbauer, W.K., ‘Pipeline Risk Assessment: The Definitive Approach and Its Role in Risk Management,’ Clarion Technical Publishers, 2015.
- Mangold, D. and Huntley, R., “Utilizing Modern Data and Technologies for Pipeline Risk Assessment,” International Pipeline Conference, Calgary, Sept. 26-30, 2016.
- PHMSA, “Pipeline risk modeling Overview of methods and tools for improved implementation,” Washington, DC, 2020.
- O’Rourke, M.J. and Liu, X., ‘Response of buried pipelines subject to earthquake effects,’ Buffalo, NY: Multidisciplinary Center for Earthquake Engineering Research, Monograph No. 3, 1999.
- Honegger, D.G., and Nyman, D.J.,“Guidelines for the seismic design and assessment of natural gas and liquid hydrocarbon pipelines,” Pipeline Research Council International Inc., Contract PR-268-9823, Houston, 2004.
- Microsoft, https://github.com/Microsoft/USBuildingFootprints, 2018.
- US Department of Homeland Security, “Homeland Infrastructure Foundation-Level Data (HIFLD),” 2017.
- Oak Ridge National Laboratory, “LandScan USA,” https://hifld-geoplatform.opendata.arcgis.com/datasets/e431a6410145450aa56606568345765b/about, 2019.
- M. D. Petersen et al., “The 2018 update of the US National Seismic Hazard Model: Overview of model and implications,” Earthquake Spectra, Vol. 36, No. 1, Nov. 28, 2019, pp. 5–41.
- Rukstales, K.S. and Petersen, M.D., “Data release for 2018 update of the US National Seismic Hazard Model,” US Geological Survey (USGS) data release, 2019.
- Wald D.J. and Allen, T.I. “Topographic slope as a proxy for seismic site conditions and amplification,” Bulletin of the Seismological Society of America, Vol. 97, No. 5, October 2007, pp. 1379–95.
- Shumway, A.M., Petersen, M.D., Powers, P.M., Rezaeian, S., Rukstales, K.S., Clayton, B.S., “The 2018 update of the US National Seismic Hazard Model: Additional period and site class data,” Earthquake Spectra, Vol. 37, No. 2, Dec. 14, 2020, pp. 1145–61.
- American Lifelines Alliance, “Guideline for assessing the performance of oil and natural gas pipeline systems in natural hazard and human threat events. Part 2 - Commentary,” Washington, DC, 2005.
- USGS, “Vs30 models and data,” https://earthquake.usgs.gov/data/vs30/.
- Boyd, O.S., “Calibration of the US Geological Survey National Crustal Model,” USGS Open-File Report 2020-1052, 2020.
- USGS, “National Crustal Model services,” https://earthquake.usgs.gov/nshmp/ncm/.
- Honegger, D.G. and Wijewickreme, D., “Seismic risk assessment for oil and gas pipelines,” Handbook of Seismic Risk Analysis and Management of Civil Infrastructure Systems, Tesfamariam, S., and Goda, K., editors, Woodhead Publishing Ltd., 2013, pp. 682–715.
- Lanzano, G., Salzano, E., De Magistris, F.S., and Fabbrocino, G., “Seismic vulnerability of gas and liquid buried pipelines,” Journal of Loss Prevention in the Process Industries, Vol. 28, Apr. 11, 2014, pp. 72–78.
- Tsinidis, G., Di Sarno, L., Sextos, A., and Furtner, P., “A critical review on the vulnerability assessment of natural gas pipelines subjected to seismic wave propagation. Part 1: Fragility relations and implemented seismic intensity measures,” Tunneling and Underground Space Technology, Vol. 86, April 2019, pp. 279–296.
- Worden, C.B, Thompson, E.M, Hearne, M., and Wald, D.J., “ShakeMap Manual Online: Technical manual, user’s guide, and software guide,” US Geological Survey, 2020.
- Allstadt, K.E., Thompson, E.M., Hearne, M., and Biegel, K., “groundfailure v1.0,” US Geological Survey software release, 2018.
- Zhu, J., Baise, L.G, and Thompson, E.M., “An Updated Geospatial Liquefaction Model for Global Application,” Bulletin of the Seismological Society of America, Vol. 107, No. 3, May 2017, pp. 1365–85, 2017.
- Nowicki Jessee, M.A., Hamburger, M.W., Allstadt, K.,Wald, D.J., Robeson, S.M., Tanyas, H., Hearne, M., and Thompson, E.M., “A global empirical model for near real-time assessment of seismically induced landslides,” Journal of Geophysical Research Earth Surface, Vol. 123, No. 8, July 23, 2018, pp. 1835–59.
- American Lifelines Alliance, “Guideline for assessing the performance of oil and natural gas pipeline systems in natural hazard and human threat events,” Washington, DC, 2005.
- Powers, P.M, Altekruse, J.M., and Abrahamson, N.A., “Support for peak ground velocity in the US Geological Survey National Seismic Hazard Model,” Report GIRS 2021-05: San Fernando Earthquake Conference- 50 Years Of Lifeline Engineering: Book of Abstracts, Version 1.1 (Davis, C.A., Yu, K., Taciroglu, E. editors), Sept. 27, 2021, pp. 162.
- Altekruse, J.M. and Powers, P.M., “Data release for PGV data for the 2018 National Seismic Hazard Model for the Conterminous United States,” USGS data release, Sept. 27, 2021.
- Hatem, A.E., Collett, C.M., Gold, R.D., Briggs, R.W., Angster, S.A., Field, E.H., Anderson, M., Ben-Horin, J.Y., Dawson, T., DeLong, S., DuRoss, C., Thompson Jobe, J., Kleber, E., Knudsen, K.L., Koehler, R., Koning, D., Lifton, Z., Madin, I., Mauch, J., Morgan, M., Pearthree, P., Petersen, M., Pollitz, F., Scharer, K., Powers, P., Sherrod, B., Stickney, M., Wittke, S., and Zachariasen, J., “Earthquake geology inputs for the U.S. National Seismic Hazard Model (NSHM) 2023, version 1.0.” USGS data release, Jan. 21, 2021.
- US Environmental Protection Agency, “Areal Locations of Hazardous Atmospheres (ALOHA) software, Version 5.4.7,”, Washington, DC, 2016 h,ttps://www.epa.gov/cameo/aloha-software.
- Lin K.-W. and Wald, D.J., “ShakeCast manual,” USGS Open-File Report 2008-1158, 2008.
- USGS, “ShakeCast,” https://www.usgs.gov/software/shakecast.
- PHMSA, “National Pipeline Mapping System Standards for Pipeline, Liquefied Natural Gas and Breakout Tank Farm Operator Submissions,” Alexandria, Va., 2017, https://www.npms.phmsa.dot.gov/Documents/Operator_Standards.pdf.
- PHMSA, “Pipeline operator annual reports,” 2018, https://www.phmsa.dot.gov/data-and-statistics/pipeline/gas-distribution-gas-gathering-gas-transmission-hazardous-liquids.
- Lanzano, G., Salzano, E., de Magistris, F.S., and Fabbrocino, G., “Seismic vulnerability of natural gas pipelines,” Reliability Engineering & System Safety, Vol. 117, September 2013 pp. 73–80.
- Kwong, N.S., Jaiswal, K.S., Luco, N., Baker, J.W., and Ludwig, K.A., “Preliminary national-scale seismic risk assessment of natural gas pipelines in the United States,” Report GIRS 2021-05: San Fernando Earthquake Conference- 50 Years Of Lifeline Engineering: Book of Abstracts, Version 1.1 (Davis, C.A., Yu, K., and Taciroglu, E. editors), p. 72, 2021.
- Kwong, N.S., Jaiswal, K.S., Baker, J.W., Luco, N., Ludwig, K.A., and Stephens, V.J., “Earthquake risk of gas pipelines in the Conterminous United States and its sources of uncertainty,” ASCE-ASME Journal of Risk Uncertainty and Engineering Systems, Part A Civil Engineering, forthcoming 2022.
- Eidinger, J.M., “Seismic fragility of natural gas transmission pipelines and wells,” G&E Engineering Systems Inc., Report R130.01.01 Revision 3, Olympic Valley, Calif., 2020.
- Pacific Earthquake Engineering Research Center, “PEER Awarded $4.9 million to Develop Seismic Risk Assessment Tool for Natural Gas Storage and Transmission Systems,” May 17, 2019.
- University of California Los Angeles, “California Energy Commission awards $3.5 million research grant on seismic risks to natural gas infrastructure to UCLA,” Dec. 9, 2019.
Acknowledgments
The first author gratefully acknowledges the US Geological Survey (USGS) Mendenhall Research Fellowship Program for providing the financial support to conduct this research. The authors thank PHMSA for providing access to the NPMS dataset and valuable feedback that helped shape this research. From USGS, Ken Rukstales assisted with geospatial analyses, Peter Powers, Jason Altekruse, and Brandon Clayton provided PGV support to the NSHMs, and Mike Hearne assisted with access to data layers used in the USGS Ground Failure product. Finally, the authors thank Martin Zaleski, Eric Thompson, and Kate Allstadt for important feedback that has improved the manuscript. Any use of trade, firm, or product names is for descriptive purposes only and does not imply endorsement by the US Government.
The authors
N. Simon Kwong ([email protected]) is a research civil engineer at the United States Geological Survey. He has degrees in structural engineering (University of California Berkeley, MS, 2010; Ph.D., 2015) and civil engineering (The Cooper Union, New York, NY, B.Eng. 2009). He is a member of the Earthquake Engineering Research Institute (EERI) and American Society of Civil Engineers (ASCE).
Kishor Jaiswal ([email protected]) is a research civil engineer at the United States Geological Survey. He has degrees in civil-earthquake engineering (Indian Institute of Technology Bombay, Ph.D., 2006) and structural engineering (National Institute of Technology, Mumbai, MS). He is a member of EERI and ASCE.
Jack Baker ([email protected]) is a professor of civil and environmental engineering at Stanford University in California. He has degrees in structural engineering (Stanford, MS, 2002; Ph.D., 2005), statistics (Stanford, MS, 2004), and mathematics-physics (Whitman College, BA, 2000, Walla Walla, Wash.). He is a member of EERI and ASCE.
Nicolas Luco ([email protected]) is a research civil engineer at the United States Geological Survey. He has degrees in structural engineering (University of California Berkeley, MS, 1996; Stanford, Ph.D., 2002), statistics (Stanford, MS, 2000), and civil engineering (Stanford, BS, 1995). He is a member of EERI and ASCE.
Kristin Ludwig ([email protected]) is a science advisor for risk reduction at the United States Geological Survey. She has degrees in oceanography (University of Washington, Ph.D., 2008) and earth systems (Stanford, BS, 1999). She is a member of the Department of the Interior Strategic Sciences Group.
Vasey Stephens ([email protected]) was an undergraduate student intern at the United States Geological Survey. She is currently working towards a BS in geological engineering at the Colorado School of Mines.
