LPG supply growth outstripping demand, infrastructure
Ken Chow
Ajey Chandra
Muse, Stancil & Co.
Houston
Craig Whitley
World Energy Consultants LLC
Houston
The rapid growth in US LPG supplies, in conjunction with advantageous propane derivative petrochemical prices and improved affordability for LPG in households, have created simultaneous supply-push and demand-pull scenarios in the global market, prompting development of numerous export and import terminals. This article will examine the degree to which demand and infrastructure development are keeping pace with supply growth.
Seaborne LPG trade
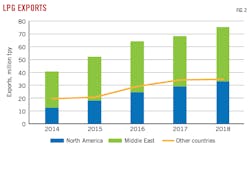
From 2014 to 2018, seaborne LPG shipments rose to 108.6 million tonnes/year (tpy) from 60.7 million tpy, driven by higher exports from the US, the Middle East, and the North Sea. Of the top ten seaborne LPG exporting countries or regions in 2018, the US, the UAE, Qatar, Saudi Arabia, Iran, the North Sea, Kuwait, and Russia all established record-high LPG export volumes. Fig. 1 shows seaborne LPG exports by region over the past 5 years and highlights the growth by the US and the Middle East relative to other exporting regions.
Exports from the Middle East and the US are now outpacing those from smaller seaborne LPG exporting nations. In recent years, smaller LPG exporting countries outside the top ten exporters had 16-19% of global market share. While these smaller LPG exporters increased their exports by 31% year-over-year 2016-17, their exports declined 2% from 2017 to 2018. While the growth of US and Middle East seaborne LPG exports continued unabated in 2018, total exports from all other countries tapered off (Fig. 2). For the time being, countries that export less than 2 million tpy of seaborne LPG may face stiffening competition in their export markets.
Strong demand
This substantial increase in the availability of seaborne LPG supplies coincided with development of LPG markets that could consume it all. Petrochemical market conditions and Asian economic growth during this time were such that the LPG supply buildup resulted in a match of supply and demand. Global seaborne LPG imports increased by 18% from 2016-18, but marine shipping infrastructure and end-use LPG markets grew fast enough to absorb this additional 16.9 million tonnes of seaborne LPG supply. Demand growth for seaborne LPG imports was led by countries in the Asia Pacific, with the top five importing countries all from that region.
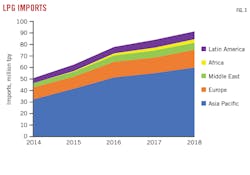
Of the top ten seaborne LPG importers in 2018, the most dramatic growth in LPG demand 2016-18 took place in India, Indonesia, and Mexico, each country experiencing more than 30% growth in seaborne LPG imports. While Asia has been the largest importing region by volume, the fastest growing region by rate of growth for LPG imports in 2018 was Europe, with a year-on-year increase of 17% compared with 8% for Asia. The top twenty largest seaborne LPG importing countries in 2018, representing 82% of the global LPG market, have generally exhibited strong growth in recent years, as illustrated by their respective regions (Fig. 3).
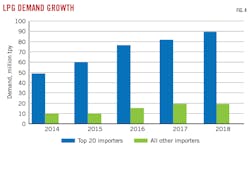
The only countries among the top twenty seaborne LPG importers that appear to be on a sustained imports decline are Brazil, largely due to increased domestic supply, and Sweden, partly attributable to changes to its petrochemical feedstock slate. LPG importing countries outside the top twenty, however, may also be decelerating their demand for seaborne LPG. After witnessing a 23% jump in LPG imports in 2017, these countries experienced just a 2% year-on-year increase in demand in 2018 as their economies slowed in general. While individually demand from each of the countries in this second tier of seaborne LPG importers is not large, collectively it is comparable to that of the largest seaborne LPG importer, China. Fig. 4 shows the flat demand for seaborne LPG imports from the smaller importing countries.
US influence
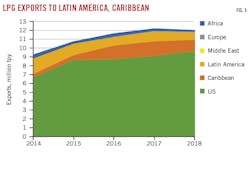
With the US increasing its seaborne LPG exports ten-fold since 2009, global LPG trade patterns have been redrawn, presenting the opportunity for traditional buyers in the international market to procure LPG from a secure supply source. Shortly after 2010, the US began shipping more LPG to markets most proximate to its export terminals, resulting in fewer deliveries to the Caribbean and Latin American markets from suppliers across the Atlantic. At the same time, some Latin American and Caribbean LPG suppliers were also increasing deliveries into the region, driven by either increased domestic production or re-export opportunities of US product. As a result, despite the growth in LPG volumes from the US, it could not increase its direct seaborne export market share in Latin America and the Caribbean as rising demand was also met by increased seaborne supplies from other nearby countries. During 2014-18, US exports into this region represented almost 100% of all seaborne LPG imports from regions outside of Latin America and the Caribbean (Fig. 5).
With LPG markets in the Americas reaching import saturation, US exports also began crossing the Atlantic with greater frequency. Southern Europe, in particular, experienced a marked increase in LPG shipments from the US.
Once the US saturated the nearest markets, the completion of the Panama Canal expansion in June 2016 enabled US LPG exporters to extend their reach to Asia. By 2015, US LPG exports to Asian markets began to erode the traditional price advantage of Middle East propane. In 2016-17, with the ability of the Panama Canal to now accommodate very larger gas carriers (VLGC), the spread between the Middle East Saudi contract price and the Mont Belvieu propane price narrowed further as the US took market share away from Middle East exporters. In 2017, year-on-year Middle East LPG exports to Asia fell (Fig. 6).
The price premium of the Saudi contract price over the Mont Belvieu price stabilized to the point where both the US and Middle East achieved record high LPG export volumes in 2018, with the Asia Pacific region being the main beneficiary. In 2019, when the Saudi contract price premium rose again, US exports to Asia continued to increase while Middle East export levels were relatively flat.
East of Suez imports
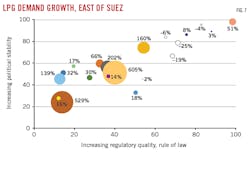
The top twenty seaborne LPG importing countries east of the Suez Canal, comprised primarily of countries in the Asia Pacific region and a few in the Middle East, represented more than 60% of the world’s LPG imports in 2018. Of these 20 countries, four had significant reductions in seaborne LPG import quantities, with declines ranging from 4% to 25% from 2016-18. Over the same period, five countries had triple-digit growth rates in seaborne LPG imports, albeit from a smaller base of less than 500,000 tonnes in 2016.
While it has been mutually beneficial to have attractively-priced LPG supplies and an expanding customer base, new customers entering the LPG marketplace do not come without potential counterparty risk. Traditional LPG buyers have a long track record as reliable and stable purchasers, while more recent importers have not had the time to establish this type of track record. Governance indicators published by the World Bank indicate that the countries with the fastest-growing demand for LPG imports are generally those perceived as having lower quality of governance. Relevant governance indicators for selling LPG into a given country include the perception of political stability, the perception of government ability to develop private-sector investment-friendly regulations, and the perception of contractual enforcement.
Fig. 7 shows that most high-growth LPG importing countries are perceived to have lower-quality governance. On the other hand, most countries with higher-quality governance had either low or negative growth rates in LPG imports 2016-18.
As US LPG production exceeded the needs of its traditional LPG markets and drove the benchmark price at Mont Belvieu downwards, US LPG exporters had to look beyond the existing customer base to increase LPG cargo deliveries. The low price of US LPG relative to international prices for competing fuels and petrochemical feedstock became attractive to consumers in other countries, leading to the mutually beneficial development of LPG export terminal facilities in the US and increasing LPG demand overseas.
Export terminal projects
A review of greenfield and expansion projects for LPG export terminals indicates it can take from 13 months to 41 months to add export capacity (Fig. 8). The time elapsed from project announcement to startup depends on the degree of project complexity, which can be affected by factors such as permitting, and whether the project scope includes construction of storage, pipeline interconnects, and marine infrastructure, as well as installation of new equipment such as chillers and pumps.
Based on a sampling of completed LPG export terminal projects, the average amount of time it takes to add LPG export capacity is 24 months. The median length of time is 20 months from project announcement to startup.
PDH projects
With the amount of export capacity coming online in the US, a degree of market coordination was needed to ensure export capacity and consumption capability were aligned and available at the same time. Propane dehydrogenation (PDH) plants, built to manufacture propylene, are sizable investments that consume enough propane to affect supply-demand balances. During 2013-16, large swathes of propane demand were met by the startup of PDH plants in China. A second, but smaller batch of PDH plants started operations in 2019. Fig. 9 is a summary of the various PDH construction times.
On average, it takes about 4 years to develop and construct a PDH project. Suppliers can develop and expand LPG export terminals in roughly half that time. From a timing perspective, LPG suppliers can build export terminals much faster than petrochemical companies can build PDH plants, putting LPG export terminals potentially at risk of being overbuilt in the short term if demand is not there yet.
OPEC LPG exports
As US LPG exports continue to increase, Organization of Petroleum Exporting Countries (OPEC) member states have witnessed a decrease in their share of the seaborne LPG export market despite increasing overall LPG exports. In 2018, OPEC countries had 37% of the global share of seaborne LPG exports while the US had 30%. This stands in contrast to 2014, when OPEC countries had a 48% share of the global LPG export market. The market share for OPEC countries has been declining since then, even while its LPG export volumes continue to increase.
Despite OPEC enacting several crude oil output cuts in the past 5 years, LPG export data confirm a lack of correlation between these two hydrocarbon categories. Fig. 10 shows OPEC crude oil output cuts did not affect OPEC LPG exports. Of the twelve OPEC member states that export seaborne LPG, only Venezuela experienced a reduction in its exports 2014-18. Increased volumes just from the Central Africa members of OPEC more than offset that loss. Meanwhile, Middle East member states significantly increased seaborne LPG exports. It is notable that these export numbers exclude Qatar, the third largest LPG exporter in the world, as it is not an OPEC member.
Tariffs, China demand
While tariffs may have the intended effect of establishing a trade barrier to hinder bilateral trade, LPG trade appears to be an exception as demand for Chinese LPG imports remained unhindered. When China imposed a retaliatory 25% import duty tariff on propane shipments from the US in August 2018, Chinese customers eliminated direct LPG imports from the US.
For a premium much smaller than the tariff, LPG cargos were exchanged with neighboring Asian destinations to circumvent the tariffs. There was no drop in LPG imports for Chinese customers (Fig. 11). The Chinese tariff redirected US cargoes to other countries but did not reduce global demand for LPG from the US.
Sustained demand growth
Government policies and price subsidies are effective methods of increasing LPG consumption, and these methods are most commonly deployed in Asian countries. India has become the second-largest LPG importer in the world as a result of government policies to increase household use of LPG. Other countries in the Asia Pacific region are also growing rapidly in their LPG demand, but from a smaller base. Coupled with potential counterparty risks, LPG exporters will face both a more challenging environment and more potential destinations to which to ship LPG.
Additional VLGC investment will be needed as exporters ship cargoes over greater distances to new destinations. It takes two VLGC to move the same annual volume of LPG from the US Gulf Coast to the Far East that one VLGC can transport from the Middle East. As Asia becomes more dependent on US LPG, the need for newbuild VLGCs will grow.
The LPG shipping market is very tight as it awaits the construction of new ships. Given the level of new LPG production expected from the US over the next 3 years, the market for LPG shipping should remain strong for several years. There should also be more demand for smaller ships as floating storage, re-exports, and transshipments have become more common.
As countries further develop their crude oil resources, LPG exports are expected to increase from North America, South America, Europe, Africa, and the Middle East. As these regions become overwhelmed with indigenous LPG supply, their exporters will look to Asia to sell excess cargoes. Using US exporters as an example, LPG made its way to nearby markets in Mexico and the Caribbean and then pushed eastward to Europe and later the Asia-Pacific. In 2019, US exporters finally reached India, and there are few markets left untapped.
Rapid growth in LPG demand for household use and as a petrochemical feedstock will be crucial in meeting the supply push from LPG exporters. Both government policy implementation and petrochemical plant construction take 4-5 years, so the demand response to new LPG supplies may not be quick enough.
The authors
Ken Chow is a senior principal in the midstream practice of global energy consultancy Muse, Stancil & Co., with more than 20 years of experience developing and operating assets in the midstream, NGL, and natural gas sectors. In addition to his consulting experience at Muse and Purvin & Gertz, he has worked for NextEra Energy, Williams, and Enron in various managerial, technical, and commercial capacities. He holds a BS in mechanical engineering from McGill University, Montreal, and formerly served on the Gas Processors Association NGL Market Information Committee.
Ajey Chandra is a director of Muse, Stancil & Co. and managing director of the Houston office where he also leads the firm’s midstream practice. Chandra joined Muse in 2014 after 28 years of experience in various facets of the midstream industry, including operations, engineering, business development, management, and consulting. His operating, consulting, and management experience includes working at Amoco, Purvin & Gertz, Hess, and NextEra Energy Resources. Chandra has a BS in chemical engineering from Texas A&M University and an MBA from the University of Houston. He has also attended executive education classes at Harvard University, Cambridge, Mass., and is a professional engineer in Texas.
Craig Whitley is president and chief executive officer of World Energy Consultants LLC, an international LPG and NGL consultancy Whitley founded in 2016 after retiring as head of global LPG analytics at BP. He has 48 years of LPG and NGL industry experience, comprised of 24 years in executive management positions with several NGL companies and 24 years as an international LPG consultant. Whitley was a senior partner at Purvin & Gertz for 18 years and president of Bonner & Moore Market Consultants before joining Purvin & Gertz. He has performed and led LPG consulting assignments in 52 countries. Whitley holds BS degrees in chemistry and zoology from Northwestern State University, Natchitoches, La., and an MBA from the University of Mississippi.


